
Compare Kallam Textiles with Similar Stocks
Dashboard
Weak Long Term Fundamental Strength as the company has not declared results in the last 6 months
- Poor long term growth as Operating profit has grown by an annual rate -216.22% of over the last 5 years
- High Debt Company with a Debt to Equity ratio (avg) of 2.35 times
- The company has been able to generate a Return on Equity (avg) of 1.38% signifying low profitability per unit of shareholders funds
The company has declared Negative results for the last 3 consecutive quarters
Risky - Negative EBITDA
Consistent Underperformance against the benchmark over the last 3 years
Stock DNA
Garments & Apparels
INR 13 Cr (Micro Cap)
NA (Loss Making)
24
0.00%
4.65
-83.03%
0.16
Total Returns (Price + Dividend) 
Latest dividend: 0.2 per share ex-dividend date: Sep-19-2022
Risk Adjusted Returns v/s
Returns Beta

News
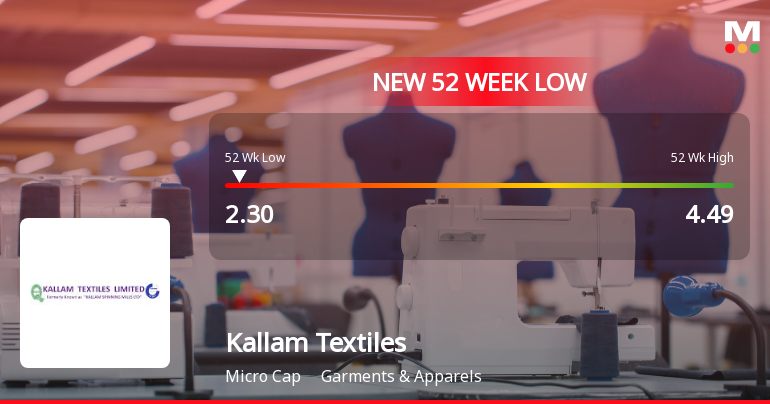
Kallam Textiles Ltd Falls to 52-Week Low of Rs 2.3 as Sell-Off Deepens
A sharp decline has pushed Kallam Textiles Ltd to a fresh 52-week low of Rs 2.3 on 3 Aug 2026, marking a 44.73% drop over the past year and underscoring persistent headwinds for this micro-cap garment sector player.
Read full news article Announcements
Compliances-Certificate under Reg. 74 (5) of SEBI (DP) Regulations 2018
20-Jul-2026 | Source : BSEKindly find the attached certificate for the quarter June 2026
Disclosure Of Imposition Of Fines Or Penalty
01-Jul-2026 | Source : BSEKindly find the attached mail received from BSE in detail regarding the levy of penalty
Closure of Trading Window
30-Jun-2026 | Source : BSEKindly find the Trading window closure PERIOD for Q1 -June 2026
Corporate Actions

No Upcoming Board Meetings

Kallam Textiles Ltd has declared 10% dividend, ex-date: 19 Sep 22

Kallam Textiles Ltd has announced 2:10 stock split, ex-date: 02 Feb 17

Kallam Textiles Ltd has announced 1:4 bonus issue, ex-date: 12 Oct 17

Kallam Textiles Ltd has announced 7:30 rights issue, ex-date: 02 Jun 22
Quality key factors
Valuation key factors
Technicals key factors
 Technical Indicator Scale: Bearish, Mildly Bearish, Sideways, Mildly Bullish, Bullish Turned
 Shareholding Snapshot : Jun 2026
Shareholding Compare (%holding)
Non Institution
None
Held by 0 Schemes
Held by 0 FIIs
Gurram Venkata Krishna Reddy (7.43%)
Iepf (2.39%)
46.9%
Quarterly Results Snapshot (Standalone) - Dec'25 - YoY

YoY Growth in quarter ended Dec 2025 is 12.35% vs -19.08% in Dec 2024
YoY Growth in quarter ended Dec 2025 is -22.01% vs -45.08% in Dec 2024
Half Yearly Results Snapshot (Standalone) - Sep'25
Growth in half year ended Sep 2025 is -2.88% vs -46.27% in Sep 2024

Growth in half year ended Sep 2025 is -66.97% vs -45.91% in Sep 2024
Nine Monthly Results Snapshot (Standalone) - Dec'25
YoY Growth in nine months ended Dec 2025 is 2.24% vs -39.43% in Dec 2024
YoY Growth in nine months ended Dec 2025 is -48.04% vs -45.56% in Dec 2024
Annual Results Snapshot (Standalone) - Mar'25
YoY Growth in year ended Mar 2025 is -32.05% vs -12.59% in Mar 2024
YoY Growth in year ended Mar 2025 is -26.49% vs -75.90% in Mar 2024
About Kallam Textiles Ltd

Company Coordinates


