
 Price Point
Compare Supreme Inds. with Similar Stocks
ScoreDashboard
High Management Efficiency with a high ROE of 19.65%
The company is Net-Debt Free
Poor long term growth as Operating profit has grown by an annual rate 0.06% of over the last 5 years
Positive results in Jun 26
With ROE of 15.5, it has a Expensive valuation with a 7.1 Price to Book Value
High Institutional Holdings at 36.16%
Consistent Underperformance against the benchmark over the last 3 years
With its market cap of Rs 44,283 cr, it is the biggest company in the sector and constitutes 23.70% of the entire sector
Mojo ParametersStock DNA

Plastic Products - Industrial

INR 43,904 Cr (Mid Cap)

42.00
32

1.05%

-0.09

15.46%

7.07
Total ReturnsTotal Returns (Price + Dividend) 
Latest dividend: 25 per share ex-dividend date: Jun-25-2026
Risk Adjusted Returns v/s
Returns Beta
 News & Corporate Actions
News
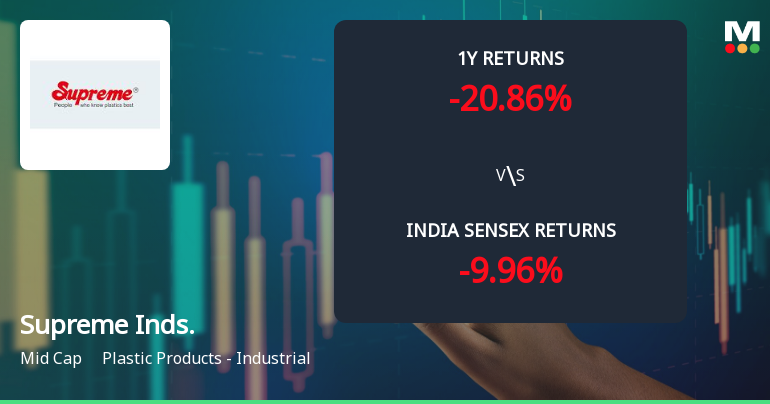
Supreme Industries Ltd Technical Momentum Shifts Amid Mixed Market Signals
Supreme Industries Ltd, a mid-cap player in the Plastic Products - Industrial sector, has experienced a notable shift in its technical momentum, moving from a mildly bearish to a bearish trend. Despite a recent downgrade in its technical trend, the stock’s mixed signals across key indicators such as MACD, RSI, Bollinger Bands, and moving averages suggest a complex outlook for investors navigating the current market environment.
Read full news article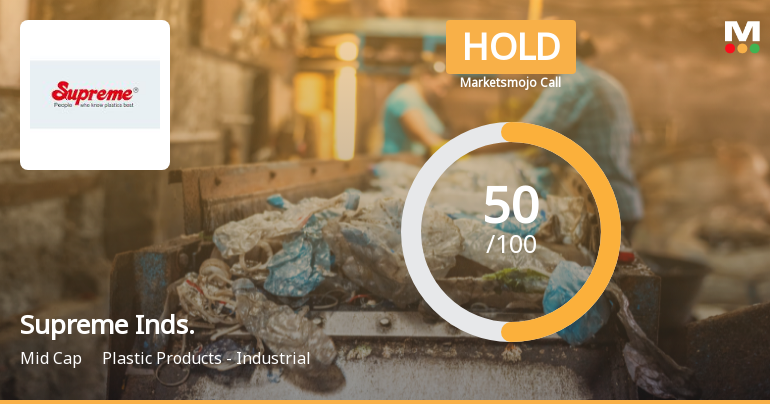
Supreme Industries Ltd Upgraded to Hold on Technical and Financial Improvements
Supreme Industries Ltd has seen its investment rating upgraded from Sell to Hold, reflecting a nuanced improvement across technical indicators, valuation metrics, financial trends, and company quality. This mid-cap player in the Plastic Products - Industrial sector has demonstrated a blend of positive quarterly results and evolving market sentiment, prompting a reassessment of its outlook by analysts.
Read full news article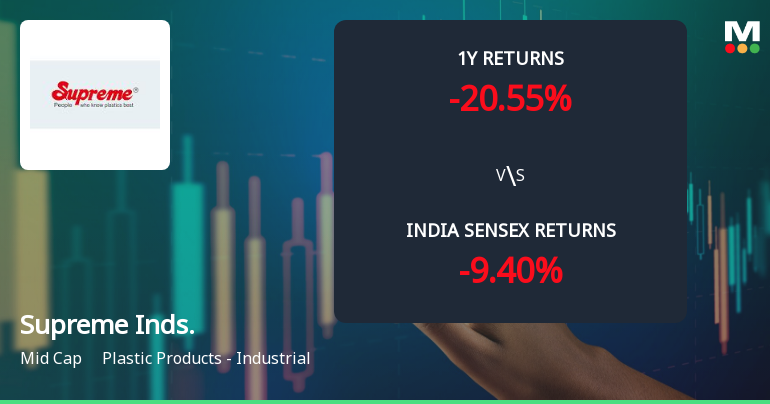
Supreme Industries Ltd Technical Momentum Shifts Amid Mixed Market Signals
Supreme Industries Ltd, a mid-cap player in the Plastic Products - Industrial sector, has witnessed a notable shift in its technical momentum, moving from a bearish stance to a mildly bearish outlook. This change is underscored by a complex interplay of technical indicators, including MACD, RSI, Bollinger Bands, and moving averages, signalling a nuanced market sentiment as the stock trades at ₹3,505, up 1.30% from the previous close.
Read full news article Announcements
Announcement under Regulation 30 (LODR)-Newspaper Publication
10-Sep-2026 | Source : BSENewspaper Publication
Disclosures under Reg. 10(6) of SEBI (SAST) Regulations 2011
04-Sep-2026 | Source : BSEThe Exchange has received the disclosure under Regulation 10(6) of SEBI (Substantial Acquisition of Shares & Takeovers) Regulations 2011 for Vijay Kumar Taparia
Disclosure Under Regulation 10 (6) Of SEBI (Substantial Acquisition Of Share And Takeover) Regulation 2011
04-Sep-2026 | Source : BSE Corporate Actions

No Upcoming Board Meetings

Supreme Industries Ltd has declared 1250% dividend, ex-date: 25 Jun 26

Supreme Industries Ltd has announced 2:10 stock split, ex-date: 18 Oct 10

Supreme Industries Ltd has announced 1:1 bonus issue, ex-date: 13 Nov 06

No Rights history available
Key FactorsQuality key factors
Valuation key factors
Technicals key factors
 Technical Indicator Scale: Bearish, Mildly Bearish, Sideways, Mildly Bullish, Bullish Turned Shareholding
Shareholding Snapshot : Jun 2026
Shareholding Compare (%holding)
Promoters
None
Held by 33 Schemes (10.67%)
Held by 555 FIIs (17.08%)
Jovial Investment And Trading Company Privatelimited (16.17%)
Nalanda India Fund Limited (2.97%)
12.28%
FinancialQuarterly Results Snapshot (Consolidated) - Jun'26 - YoY
 Compare with Peers
YoY Growth in quarter ended Jun 2026 is 4.16% vs -1.03% in Jun 2025
YoY Growth in quarter ended Jun 2026 is 38.76% vs -26.00% in Jun 2025

Half Yearly Results Snapshot (Consolidated) - Sep'25

Growth in half year ended Sep 2025 is 1.91% vs 4.96% in Sep 2024
Growth in half year ended Sep 2025 is -23.53% vs 4.63% in Sep 2024
Nine Monthly Results Snapshot (Consolidated) - Dec'25
YoY Growth in nine months ended Dec 2025 is 3.65% vs 4.11% in Dec 2024
YoY Growth in nine months ended Dec 2025 is -21.97% vs -6.71% in Dec 2024
Annual Results Snapshot (Consolidated) - Mar'26
YoY Growth in year ended Mar 2026 is 7.38% vs 3.08% in Mar 2025
YoY Growth in year ended Mar 2026 is -0.72% vs -10.17% in Mar 2025
 Company CV
About Supreme Industries Ltd










