
 Price Point
Compare Glenmark Pharma with Similar Stocks
ScoreDashboard
Strong ability to service debt as the company has a low Debt to EBITDA ratio of 0.13 times
With ROE of 26.9, it has a Attractive valuation with a 6.6 Price to Book Value
High Institutional Holdings at 39.54%
Company is among the highest 1% of companies rated by MarketsMojo across all 4,000 stocks
Consistent Returns over the last 3 years
Mojo ParametersStock DNA

Pharmaceuticals & Biotechnology

INR 67,803 Cr (Mid Cap)

22.00
38

0.20%

-0.06

26.86%

6.56
Total ReturnsTotal Returns (Price + Dividend) 
Latest dividend: 2.5 per share ex-dividend date: Aug-31-2026
Risk Adjusted Returns v/s
Returns Beta
 News & Corporate Actions
News
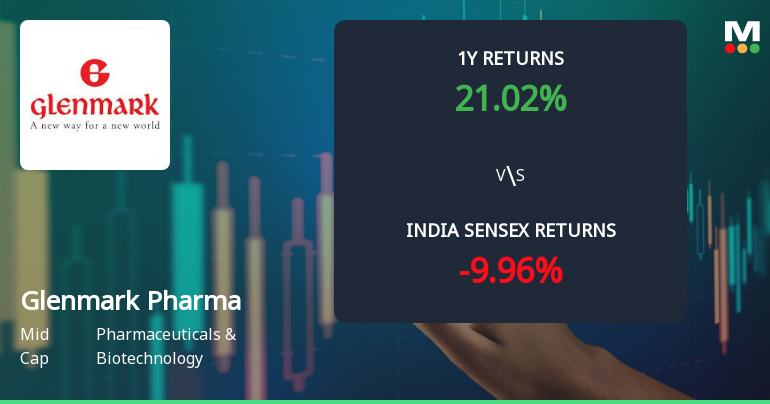
Glenmark Pharmaceuticals Ltd. Technical Momentum Shifts Amid Mixed Indicator Signals
Glenmark Pharmaceuticals Ltd., a mid-cap player in the Pharmaceuticals & Biotechnology sector, has experienced a nuanced shift in its technical momentum, reflecting a transition from a bullish to a mildly bullish trend. Despite a slight dip in the daily price, the stock’s technical indicators present a complex picture, with some signals pointing to strength while others suggest caution. This article analyses the recent technical parameter changes, key momentum indicators, and the stock’s performance relative to the broader market.
Read full news article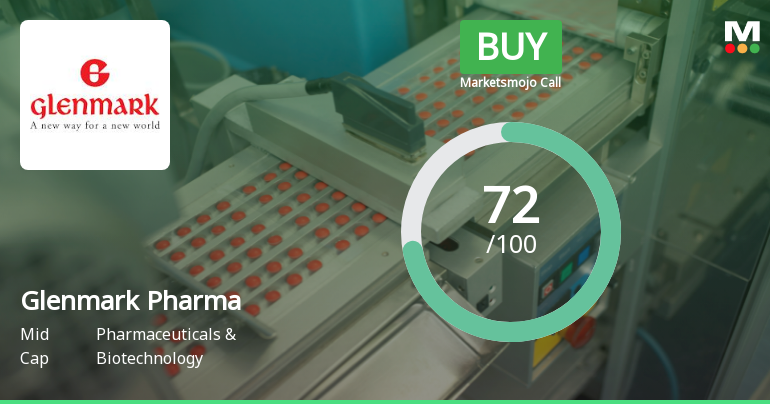
Glenmark Pharmaceuticals Upgraded to Buy on Strong Technical and Valuation Metrics
Glenmark Pharmaceuticals Ltd. has seen its investment rating upgraded from Hold to Buy, driven primarily by a marked improvement in technical indicators, attractive valuation metrics, and a solid financial trend despite recent quarterly flatness. The mid-cap pharmaceutical company’s Mojo Score has risen to 72.0, reflecting renewed investor confidence amid a backdrop of strong long-term returns and robust fundamentals.
Read full news article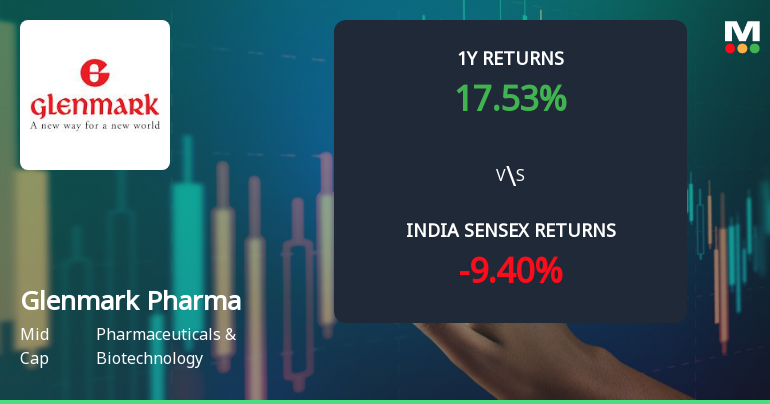
Glenmark Pharmaceuticals Ltd. Technical Momentum Shifts to Bullish Amid Strong Returns
Glenmark Pharmaceuticals Ltd. has demonstrated a notable shift in technical momentum, with key indicators signalling a bullish trend. Following a recent upgrade in its Mojo Grade from Hold to Buy, the mid-cap pharmaceutical company’s stock price has surged by 2.94% to ₹2,450, reflecting renewed investor confidence amid positive technical signals and robust price action.
Read full news article Announcements
Announcement under Regulation 30 (LODR)-Press Release / Media Release
23-Sep-2026 | Source : BSEGlenmark Pharmaceuticals receives Establishment Inspection Report (EIS) from U.S. FDA for its Goa facility with VAI classification
Announcement under Regulation 30 (LODR)-Analyst / Investor Meet - Intimation
21-Sep-2026 | Source : BSEDisclosure under Regulation 30 of the SEBI (Listing Obligations and Disclosure Requirements) Regulations 2015 - Schedule of Analyst/ Institutional Investor Meetings
Announcement under Regulation 30 (LODR)-Credit Rating
11-Sep-2026 | Source : BSEPlease find enclosed rating rationale issued by India Ratings and Research
Corporate Actions

No Upcoming Board Meetings

Glenmark Pharmaceuticals Ltd. has declared 250% dividend, ex-date: 31 Aug 26

Glenmark Pharmaceuticals Ltd. has announced 1:2 stock split, ex-date: 10 Sep 07

No Bonus history available

No Rights history available
Key FactorsQuality key factors
Valuation key factors
Technicals key factors
 Technical Indicator Scale: Bearish, Mildly Bearish, Sideways, Mildly Bullish, Bullish Turned Shareholding
Shareholding Snapshot : Jun 2026
Shareholding Compare (%holding)
Promoters
None
Held by 37 Schemes (16.76%)
Held by 376 FIIs (20.89%)
Saldanha Family Trust (45.44%)
Hdfc Mutual Fund - Hdfc Mid-cap Fund (6.22%)
10.6%
FinancialQuarterly Results Snapshot (Consolidated) - Jun'26 - QoQ
 Compare with Peers
QoQ Growth in quarter ended Jun 2026 is 6.57% vs -3.33% in Mar 2026
QoQ Growth in quarter ended Jun 2026 is 60.22% vs -25.25% in Mar 2026

Half Yearly Results Snapshot (Consolidated) - Sep'25
Growth in half year ended Sep 2025 is 39.43% vs 6.96% in Sep 2024

Growth in half year ended Sep 2025 is -5.37% vs 921.44% in Sep 2024
Nine Monthly Results Snapshot (Consolidated) - Dec'25
YoY Growth in nine months ended Dec 2025 is 31.26% vs 15.03% in Dec 2024
YoY Growth in nine months ended Dec 2025 is 1.73% vs 467.86% in Dec 2024
Annual Results Snapshot (Consolidated) - Mar'26
YoY Growth in year ended Mar 2026 is 27.48% vs 12.77% in Mar 2025
YoY Growth in year ended Mar 2026 is 30.06% vs 169.73% in Mar 2025
 Company CV
About Glenmark Pharmaceuticals Ltd.










