
Compare Unjha Formul. with Similar Stocks
Stock DNA
Pharmaceuticals & Biotechnology
INR 9 Cr (Micro Cap)
13.00
35
0.00%
-0.43
18.49%
2.33
Total Returns (Price + Dividend) 
Unjha Formul. for the last several years.
Risk Adjusted Returns v/s
Returns Beta

News
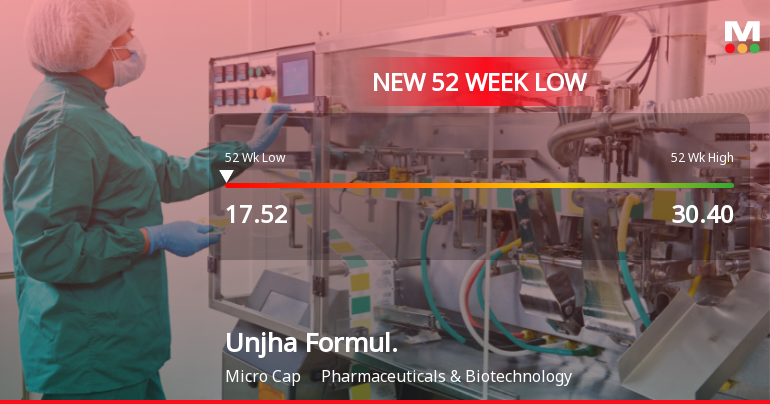
Unjha Formulations Ltd Falls to 52-Week Low of Rs 17.52 as Sell-Off Deepens
A sharp decline of 12.36% today dragged Unjha Formulations Ltd to a fresh 52-week low of Rs 17.52, marking a significant setback after four consecutive days of gains. This drop comes amid a broader market rally, highlighting a stark divergence in the stock’s performance.
Read full news article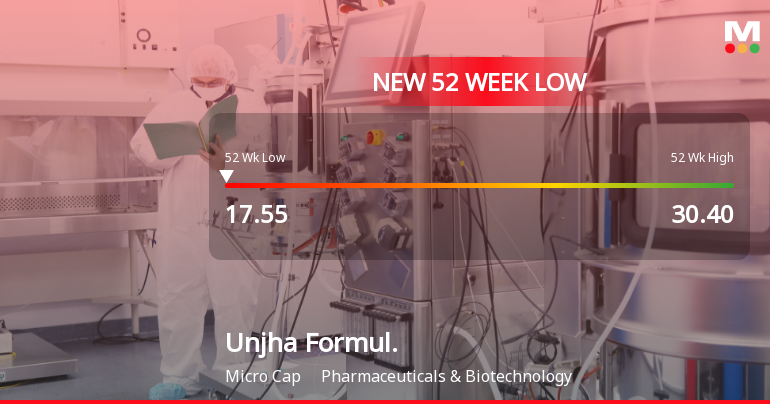
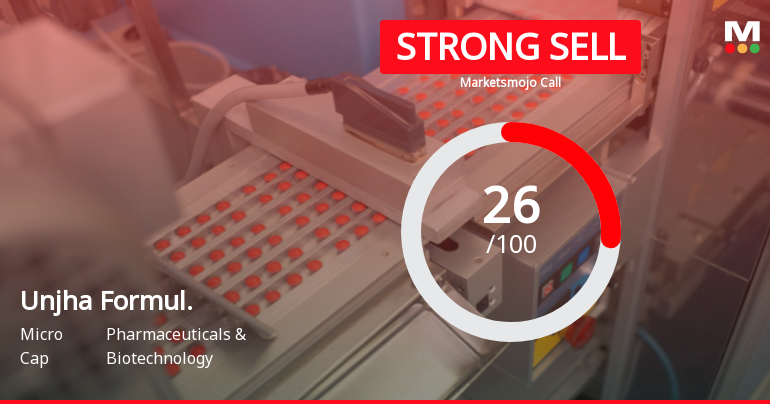
Unjha Formulations Ltd Downgraded to Strong Sell Amid Weak Financials and Bearish Technicals
Unjha Formulations Ltd has been downgraded from a Sell to a Strong Sell rating as of 1 June 2026, reflecting deteriorating technical indicators and persistent financial weaknesses. Despite a very attractive valuation, the company’s flat quarterly performance, operating losses, and bearish technical trends have compelled analysts to revise their outlook, signalling caution for investors in this pharmaceuticals micro-cap.
Read full news article Announcements
Outcome Of Board Meeting - Appointment Of Company Secretary And Compliance Officer.
01-Jun-2026 | Source : BSEREGULATION 6(1) AND 30(4) WITH PART A OF SCH II OF SEBI(LODR)REGULATION2015
Publish Audited Financial Results For The Quarter And Year Ended As On 31/03/2026
20-May-2026 | Source : BSERegulation 33(3) of SEBI (lodr) 2015
Publish Audited Financial Results For The Quarter And Year Ended As On 31/03/2026
20-May-2026 | Source : BSERegulation 33(3) of SEBI (lodr) 2015
Corporate Actions

No Upcoming Board Meetings

No Dividend history available

No Splits history available

No Bonus history available

No Rights history available
Quality key factors
Valuation key factors
Technicals key factors
 Technical Indicator Scale: Bearish, Mildly Bearish, Sideways, Mildly Bullish, Bullish Turned
 Shareholding Snapshot : Mar 2026
Shareholding Compare (%holding)
Non Institution
None
Held by 0 Schemes
Held by 0 FIIs
Jashodaben Shambhubhai Patel (16.51%)
Esha Mayank Patel (1.6%)
55.53%
Quarterly Results Snapshot (Standalone) - Mar'26 - QoQ

QoQ Growth in quarter ended Mar 2026 is -25.62% vs 2.80% in Dec 2025
QoQ Growth in quarter ended Mar 2026 is -408.33% vs -70.73% in Dec 2025
Half Yearly Results Snapshot (Standalone) - Sep'25

Growth in half year ended Sep 2025 is 2.20% vs -9.27% in Sep 2024
Growth in half year ended Sep 2025 is 105.08% vs 883.33% in Sep 2024
Nine Monthly Results Snapshot (Standalone) - Dec'25
YoY Growth in nine months ended Dec 2025 is 7.14% vs -18.34% in Dec 2024
YoY Growth in nine months ended Dec 2025 is 79.01% vs 80.00% in Dec 2024
Annual Results Snapshot (Standalone) - Mar'26
YoY Growth in year ended Mar 2026 is 12.48% vs -25.08% in Mar 2025
YoY Growth in year ended Mar 2026 is 70.73% vs 46.43% in Mar 2025
About Unjha Formulations Ltd

Company Coordinates


