
Compare Laffans Petroch with Similar Stocks
Dashboard
With a Operating Losses, the company has a Weak Long Term Fundamental Strength
- Company's ability to service its debt is weak with a poor EBIT to Interest (avg) ratio of -2.71
- The company has reported losses. Due to this company has reported negative ROCE
Flat results in Mar 26
Risky - Negative EBITDA
Consistent Underperformance against the benchmark over the last 3 years
Total Returns (Price + Dividend) 
Laffans Petroch for the last several years.
Risk Adjusted Returns v/s
Returns Beta

News
Are Laffans Petrochemicals Ltd latest results good or bad?
Laffans Petrochemicals Ltd's latest financial results for Q4 FY26 reveal significant operational challenges. The company reported a net loss of ₹3.26 crores, a stark contrast to the profit of ₹1.56 crores in the previous quarter (Q3 FY26). This represents a substantial deterioration in profitability, primarily driven by a drastic decline in other income, which swung from a positive ₹2.33 crores to a negative ₹2.73 crores. On the revenue front, Laffans experienced a robust quarter-on-quarter growth of 96.88%, with net sales reaching ₹1.89 crores, up from ₹0.96 crores in Q3 FY26. However, despite this revenue growth, the operating margin remained deeply negative at -43.39%, indicating persistent issues with operational efficiency and profitability. The operating profit before depreciation, interest, and tax (PBDIT) was negative ₹0.82 crores, marking the worst performance in recent quarters. Year-on-year co...
Read full news article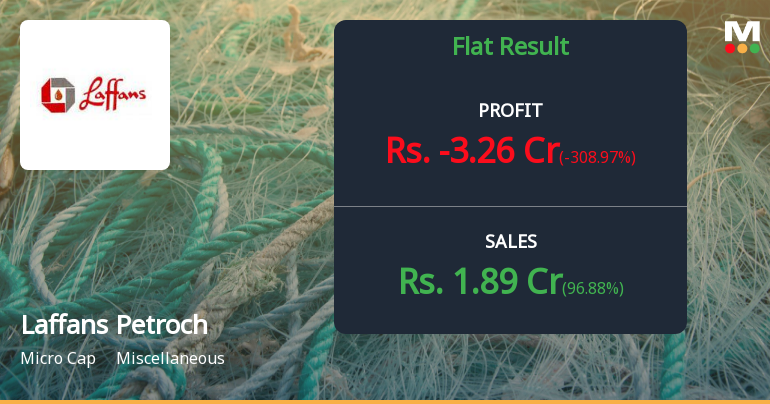
Laffans Petrochemicals Q4 FY26: Losses Deepen as Operational Struggles Persist
Laffans Petrochemicals Ltd., the Gujarat-based petrochemical derivatives manufacturer, reported a troubling fourth quarter for FY26, with net losses widening significantly to ₹3.26 crores compared to a profit of ₹1.56 crores in the previous quarter. The company, with a modest market capitalisation of ₹22.00 crores, continues to grapple with persistent operational challenges despite a sharp sequential revenue recovery. The stock has responded negatively to the weak results, declining 4.68% to ₹27.28 on May 27, 2026, and now trades 34.71% below its 52-week high of ₹41.78.
Read full news article
Laffans Petrochemicals Ltd is Rated Strong Sell
Laffans Petrochemicals Ltd is rated Strong Sell by MarketsMOJO, with this rating last updated on 04 Feb 2025. However, the analysis and financial metrics presented here reflect the company’s current position as of 21 May 2026, providing investors with an up-to-date view of its fundamentals, valuation, financial trend, and technical outlook.
Read full news article Announcements
Closure of Trading Window
29-Jun-2026 | Source : BSEWe are hereby submitting the closure of trading window for the quarter ended June 30 2026.
Compliances-Reg.24(A)-Annual Secretarial Compliance
29-May-2026 | Source : BSEWe are hereby submitting the Annual Secretarial Compliance Report for the Year ended 31st March 2026
Announcement under Regulation 30 (LODR)-Newspaper Publication
28-May-2026 | Source : BSEPlease find enclosed the copies of newspaper publications.
Corporate Actions

No Upcoming Board Meetings

No Dividend history available

No Splits history available

No Bonus history available

No Rights history available
Quality key factors
Valuation key factors
Technicals key factors
 Technical Indicator Scale: Bearish, Mildly Bearish, Sideways, Mildly Bullish, Bullish Turned
 Shareholding Snapshot : Mar 2026
Shareholding Compare (%holding)
Promoters
None
Held by 1 Schemes (0.13%)
Held by 0 FIIs
Sandeep Seth (53.49%)
Mahendra Girdharilal Wadhwani (4.99%)
38.7%
Quarterly Results Snapshot (Standalone) - Mar'26 - QoQ

QoQ Growth in quarter ended Mar 2026 is 96.88% vs -46.07% in Dec 2025

QoQ Growth in quarter ended Mar 2026 is -308.97% vs 136.19% in Dec 2025
Half Yearly Results Snapshot (Standalone) - Sep'25
Growth in half year ended Sep 2025 is -63.84% vs 535.16% in Sep 2024
Growth in half year ended Sep 2025 is -67.44% vs 121.16% in Sep 2024
Nine Monthly Results Snapshot (Standalone) - Dec'25
YoY Growth in nine months ended Dec 2025 is -55.60% vs 65.54% in Dec 2024
YoY Growth in nine months ended Dec 2025 is -17.34% vs -13.11% in Dec 2024
Annual Results Snapshot (Standalone) - Mar'26
YoY Growth in year ended Mar 2026 is -39.46% vs 34.65% in Mar 2025
YoY Growth in year ended Mar 2026 is -79.50% vs -23.08% in Mar 2025
About Laffans Petrochemicals Ltd

Company Coordinates


