
Compare Market Creators with Similar Stocks
Dashboard
With a Operating Losses, the company has a Weak Long Term Fundamental Strength
- Poor long term growth as Net Sales has grown by an annual rate of 7.36% and Operating profit at 8.88%
Negative results in Mar 26
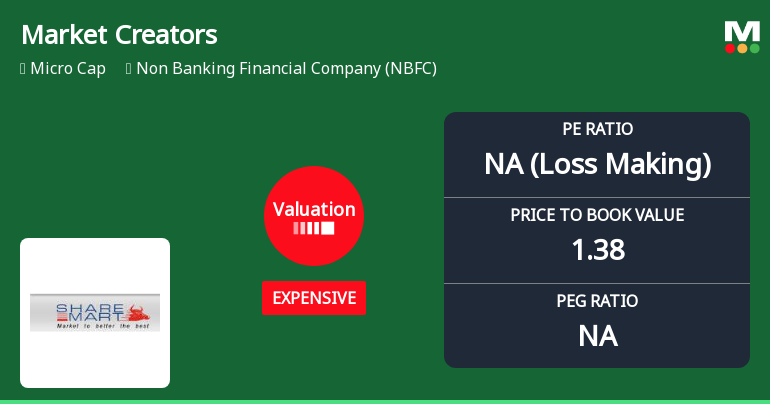
With ROE of -4.8, it has a Expensive valuation with a 1.5 Price to Book Value
Reducing Promoter Confidence
Stock DNA
Non Banking Financial Company (NBFC)
INR 16 Cr (Micro Cap)
NA (Loss Making)
21
0.00%
0.56
-4.84%
1.47
Total Returns (Price + Dividend) 
Latest dividend: 1.0000 per share ex-dividend date: Mar-29-2007
Risk Adjusted Returns v/s
Returns Beta

News
Market Creators Ltd Valuation Shift Signals Price Attractiveness Change Amid NBFC Sector Dynamics
Market Creators Ltd, a micro-cap player in the Non Banking Financial Company (NBFC) sector, has experienced a notable shift in its valuation parameters, moving from a very expensive to an expensive rating. This change, coupled with a recent downgrade to a Strong Sell rating, reflects growing concerns about the company’s financial health and market positioning amid a challenging NBFC landscape.
Read full news article
Market Creators Ltd Valuation Shifts Signal Price Attractiveness Change Amid NBFC Sector Dynamics
Market Creators Ltd, a micro-cap player in the Non Banking Financial Company (NBFC) sector, has experienced a notable shift in its valuation parameters, moving from a very expensive to an expensive rating. This change reflects evolving market perceptions amid challenging sector dynamics and company-specific performance metrics, prompting a reassessment of its price attractiveness relative to peers and historical benchmarks.
Read full news article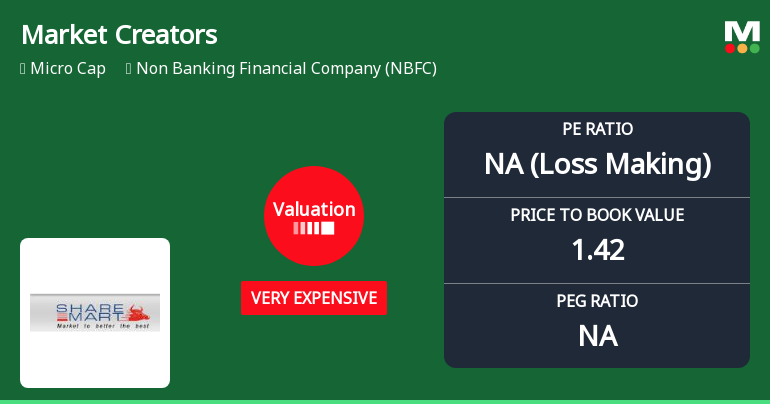
Market Creators Ltd Valuation Shifts Signal Heightened Price Risk
Market Creators Ltd, a micro-cap player in the Non Banking Financial Company (NBFC) sector, has seen a notable shift in its valuation parameters, moving from an already expensive rating to a very expensive one. Despite a recent uptick in share price, the company’s price-to-earnings (P/E) and price-to-book value (P/BV) ratios suggest a growing disconnect between market price and underlying fundamentals, raising questions about its price attractiveness relative to peers and historical averages.
Read full news article Announcements
Announcement under Regulation 30 (LODR)-Newspaper Publication
01-Jun-2026 | Source : BSENEWSPAPER PUBLICATION FOR QUARTER AND YEAR ENDED 31.03.2026
Compliances-Reg.24(A)-Annual Secretarial Compliance
30-May-2026 | Source : BSEANNUAL SECRETARIAL COMPLIANCE REPORT FOR FY 2025-2026
Disclosure Under Regulation 32(1) Of SEBI (Listing Obligations And Disclosure Requirements) Regulations 2015
30-May-2026 | Source : BSERegulation 32(1) of SEBI LODR Regulation 2015
Corporate Actions

No Upcoming Board Meetings

Market Creators Ltd has declared 10% dividend, ex-date: 29 Mar 07

No Splits history available

No Bonus history available

No Rights history available
Quality key factors
Valuation key factors
Technicals key factors
 Technical Indicator Scale: Bearish, Mildly Bearish, Sideways, Mildly Bullish, Bullish Turned
 Shareholding Snapshot : Mar 2026
Shareholding Compare (%holding)
Promoters
None
Held by 0 Schemes
Held by 0 FIIs
Jayantilal Harkisondas Shah (41.15%)
Laxmipat Dudheria (1.6%)
26.84%
Quarterly Results Snapshot (Standalone) - Mar'26 - QoQ

QoQ Growth in quarter ended Mar 2026 is 4,300.00% vs -90.08% in Dec 2025

QoQ Growth in quarter ended Mar 2026 is 0.00% vs 100.00% in Dec 2025
Half Yearly Results Snapshot (Standalone) - Sep'25
Growth in half year ended Sep 2025 is -37.23% vs 46.50% in Sep 2024
Growth in half year ended Sep 2025 is -212.50% vs 1,500.00% in Sep 2024
Nine Monthly Results Snapshot (Standalone) - Dec'25
YoY Growth in nine months ended Dec 2025 is -53.78% vs 28.79% in Dec 2024
YoY Growth in nine months ended Dec 2025 is -180.00% vs 200.00% in Dec 2024
Annual Results Snapshot (Standalone) - Mar'26
YoY Growth in year ended Mar 2026 is -25.53% vs 6.46% in Mar 2025
YoY Growth in year ended Mar 2026 is -216.67% vs 700.00% in Mar 2025
About Market Creators Ltd

Company Coordinates


