Adani Enterp.

  • Market Cap: Large Cap
  • Industry: Diversified
  • ISIN: INE423A01024
  • NSEID: ADANIENT
  • BSEID: 512599
INR
2,969.95
49.7 (1.7%)
BSENSE

Jun 15, 11:38 AM

BSE+NSE Vol: 5.49 lacs

  • Price Points
  • Score
  • Mojo Parameters
  • Total Return
  • News and Corporate Actions
  • Key factors
  • Shareholding
  • Financials
  • CompanyCV
stock-summaryPrice Point
High/Low

1Day

52 Week

Valuation
Technical
Day's Volume

CASH

5.49 lacs (-29.42%) Volume

Shareholding (Mar 2026)

FII

10.80%

Held by 461 FIIs

DII

6.70%

Held by 45 DIIs

Promoter

74.67%

Why is Adani Enterprises Ltd falling/rising?

14-Jun-2026

As of 14-Jun, Adani Enterprises Ltd's stock price is rising to 2,920.25, following a trend reversal after two days of decline, indicating potential recovery in investor sentiment. The company shows strong long-term growth prospects with significant sales and profit increases, alongside rising promoter confidence.

As of 14-Jun, Adani Enterprises Ltd's stock price is rising, currently at 2,920.25, with a change of 12.1 (0.42%) upward. This increase follows a trend reversal after two consecutive days of decline, indicating a potential recovery in investor sentiment. The stock has shown strong performance over the past month, with a gain of 21.44%, significantly outperforming the Sensex, which only increased by 1.30% during the same period. <BR><BR>Moreover, the company's long-term growth prospects appear healthy, with net sales growing at an annual rate of 20.50% and operating profit at 31.89%. Additionally, there is rising promoter confidence, as the promoters have increased their stake by 0.7% over the previous quarter, now holding 74.67% of the company. This increase in stake is often interpreted as a sign of confidence in the company's future.<BR><BR>Despite some recent underperformance relative to its sector, the stock has managed to generate a return of 19.01% over the past year, while the broader market has seen negative returns of -2.24%. Furthermore, the stock is close to its 52-week high, being only 4.74% away from Rs 3,058.7, which may attract more investors looking for upward momentum. Overall, these factors contribute to the stock's rising price.

View full answer

How big is Adani Enterp.?

11-Jun-2026

As of 10th June, Adani Enterprises Ltd has a market capitalization of 385,979.00 Cr, with net sales of 100,468.61 Cr and a net profit of 9,339.47 Cr over the latest four quarters.

As of 10th June, <BR><BR>Market Cap: Adani Enterprises Ltd has a market capitalization of 385,979.00 Cr, categorized as Large Cap.<BR><BR>Recent Quarterly Performance: The sum of Net Sales for the latest 4 quarters is 100,468.61 Cr, while the sum of Net Profit for the same period is 9,339.47 Cr.<BR><BR>Balance Sheet Snapshot: The reporting period is March 2026, with Shareholder's Funds amounting to 80,925.95 Cr and Total Assets totaling 2,60,868.38 Cr.

View full answer

Who are in the management team of Adani Enterp.?

11-Jun-2026

The management team of Adani Enterprises includes Executive Chairman Gautam S Adani, Managing Director Rajesh S Adani, and Executive Directors Pranav Adani and Vinay Prakash, along with Company Secretary Jatin Jalundhwala. The board also features independent directors such as Hemant Nerurkar and Venkataraman Subramanian.

The management team of Adani Enterprises includes the following key members:<BR><BR>1. **Gautam S Adani** - Executive Chairman<BR>2. **Rajesh S Adani** - Managing Director<BR>3. **Pranav Adani** - Executive Director<BR>4. **Vinay Prakash** - Executive Director<BR>5. **Jatin Jalundhwala** - Company Secretary & Compliance Officer<BR><BR>Additionally, the board features several independent directors:<BR>- **Hemant Nerurkar**<BR>- **Venkataraman Subramanian**<BR>- **Vijaylaxmi Joshi**<BR>- **Narendra Mairpady**<BR>- **Omkar Goswami**<BR><BR>This team plays a crucial role in guiding the strategic direction and operations of the company.

View full answer

Who are the peers of the Adani Enterp.?

11-Jun-2026

Adani Enterprises' peers include 3M India, Godrej Industries, DCM Shriram, and others, with varying management and growth risks. Adani Enterprises has a 1-year return of 18.23%, outperforming Godrej Industries, which has a return of -20.47%.

Peers: The peers of Adani Enterp. are 3M India, Godrej Industrie, DCM Shriram, Swan Corp, Sindhu Trade, Balmer Lawrie, TTK Healthcare, Dhunseri Vent., Empire Inds., and Aspinwall & Co.<BR><BR>Quality Snapshot: Excellent management risk is observed at 3M India, while Good management risk is found at DCM Shriram and the rest. Below Average management risk is noted for Adani Enterp., Godrej Industrie, Swan Corp, Sindhu Trade, and the rest. Excellent growth is seen at Adani Enterp., 3M India, and Godrej Industrie, while Good growth is observed at DCM Shriram and the rest. Below Average growth is present in Swan Corp, Sindhu Trade, Balmer Lawrie, TTK Healthcare, Dhunseri Vent., Empire Inds., and Aspinwall & Co. Below Average capital structure is noted for Adani Enterp., Godrej Industrie, Swan Corp, and the rest, while Excellent capital structure is found at 3M India, DCM Shriram, Sindhu Trade, Balmer Lawrie, TTK Healthcare, and the rest.<BR><BR>Return Snapshot: Adani Enterp. has a 1-year return of 18.23%, while Godrej Industrie has the lowest at -20.47%. In comparison, Adani Enterp.'s return is significantly higher than that of Godrej Industrie. Additionally, several peers, including DCM Shriram, Swan Corp, Balmer Lawrie, TTK Healthcare, Dhunseri Vent., and Empire Inds., have negative six-month returns.

View full answer

What does Adani Enterp. do?

10-Jun-2026

Adani Enterprises Ltd is a large-cap diversified company, originally founded as Adani Exports in 1992. As of March 2026, it reported net sales of ₹32,439 Cr and a net profit of -₹221 Cr, with a market cap of ₹385,979 Cr.

Overview:<BR>Adani Enterprises Ltd operates in the diversified industry and is classified as a large-cap company.<BR><BR>History:<BR>The company was incorporated in March 1992 as 'Adani Exports Limited' and transitioned to a joint stock company in 1993. It received the 'Star Trading House' status in April 1993 and was upgraded to 'Super Star Trading House' in April 1994. The latest quarterly results report net sales and net profit for March 2026.<BR><BR>Financial Snapshot:<BR>Most recent Net Sales: 32,439 Cr (Quarterly Results - Mar 2026) <BR>Most recent Net Profit: -221 Cr (Quarterly Results - Mar 2026) <BR>Market-cap value: INR 385,979 Cr (Large Cap)<BR><BR>Key Metrics:<BR>P/E: 184.00 <BR>Industry P/E: 93 <BR>Dividend Yield: 0.04% <BR>Debt-Equity: 1.14 <BR>Return on Equity: 2.57% <BR>Price to Book: 4.79 <BR><BR>Contact Details:<BR>Address: Adani Corporate House, Shantigram SG Highway Khodiyar Ahmedabad Gujarat : 382421 <BR>Tel: 91-79-26565555 <BR>Email: info@adani.com <BR>Website: http://www.adanienterprises.com

View full answer

Should I buy, sell or hold Adani Enterprises Ltd?

28-May-2026

Are Adani Enterprises Ltd latest results good or bad?

03-Feb-2026

Adani Enterprises Ltd's latest results show a significant net profit increase of 9,630.28% to ₹5,627.02 crores, but this is largely due to a low base effect. Operationally, modest revenue growth and declining margins, along with high debt levels, raise concerns about the company's long-term financial health.

Adani Enterprises Ltd's latest results present a mixed picture. On one hand, the company reported a remarkable net profit of ₹5,627.02 crores for Q3 FY26, reflecting an extraordinary year-on-year increase of 9,630.28%. This surge in profit is certainly impressive, but it is important to note that it was largely influenced by a low base effect and unusual profit before tax movements.<BR><BR>In terms of operational performance, net sales grew modestly by 8.63% year-on-year to ₹24,819.59 crores, which indicates that revenue growth is not as robust as the profit figures suggest. Additionally, the operating margin declined by 191 basis points year-on-year to 14.67%, raising concerns about the company's ability to maintain profitability.<BR><BR>Another significant issue is the company's high debt levels, with a debt-to-equity ratio of 2.03 times. This elevated leverage, combined with weak capital efficiency metrics—such as a return on capital employed (ROCE) of just 5.61%—indicates potential challenges in sustaining value creation in the long term.<BR><BR>Overall, while the headline profit growth is noteworthy, the underlying operational challenges and financial health concerns suggest that the results may not be as positive as they initially appear. Investors should weigh these factors carefully when considering the company's performance.

View full answer

When is the next results date for Adani Enterprises Ltd?

21-Jan-2026

The next results date for Adani Enterprises Ltd is February 3, 2026.

The next results date for Adani Enterprises Ltd is scheduled for February 3, 2026.

View full answer

Is Adani Enterp. technically bullish or bearish?

02-Dec-2025

As of December 1, 2025, the market trend has shifted to mildly bearish, influenced by bearish MACD signals, mixed KST indications, and overall price declines, despite some mildly bullish moving averages.

As of 1 December 2025, the technical trend has changed from mildly bullish to mildly bearish. The current stance is mildly bearish, driven by bearish signals from the MACD on both weekly and monthly time frames, as well as bearish indications from the Bollinger Bands. The KST shows a bullish signal on the weekly chart but is bearish monthly, indicating mixed signals. The moving averages on the daily chart are mildly bullish, but this is overshadowed by the overall bearish trend. The lack of clear trends in the Dow Theory and OBV further supports the bearish outlook. Overall, the strength of the bearish stance is moderate, influenced by recent price declines and underperformance compared to the Sensex.

View full answer

How has been the historical performance of Adani Enterp.?

01-Dec-2025

Adani Enterprises has shown significant growth in financial metrics, with net sales rising from 39,537.13 crore in March 2021 to 97,894.75 crore in March 2025, and profit before tax increasing from 1,085.97 crore to 10,478.74 crore in the same period. The company's total assets grew from 46,625.59 crore in March 2020 to 1,97,842.88 crore by March 2025, indicating robust expansion.

Answer:<BR>The historical performance of Adani Enterprises shows significant growth in various financial metrics over the years.<BR><BR>Breakdown:<BR>Adani Enterprises has demonstrated a strong upward trend in net sales, increasing from 39,537.13 crore in March 2021 to 97,894.75 crore in March 2025, despite a peak of 1,27,539.50 crore in March 2023. The total operating income followed a similar trajectory, reaching 97,894.75 crore in March 2025. Operating profit (PBDIT) also saw substantial growth, rising from 2,505.05 crore in March 2021 to 16,722.36 crore in March 2025, with a notable operating profit margin of 14.56% in the latest fiscal year. Profit before tax surged to 10,478.74 crore in March 2025, up from 1,085.97 crore in March 2021, while profit after tax reached 7,510.22 crore, reflecting a PAT margin of 7.67%. The company's total assets increased significantly from 46,625.59 crore in March 2020 to 1,97,842.88 crore in March 2025, alongside total liabilities rising to 1,97,842.88 crore. Cash flow from operating activities showed a decline to 4,513.00 crore in March 2025 from 17,626.00 crore in March 2023, although net cash inflow remained positive at 751.00 crore in March 2025. Overall, Adani Enterprises has shown robust growth in revenue and profitability, with increasing assets and liabilities reflecting its expansion strategy.

View full answer

Is Adani Enterp. overvalued or undervalued?

06-Nov-2025

As of November 4, 2025, Adani Enterprises is fairly valued with a PE ratio of 133.60, but has underperformed the Sensex with a year-to-date return of -4.36%, indicating potential growth challenges compared to peers like Tata Chemicals and SRF.

As of 4 November 2025, Adani Enterprises has moved from expensive to fair in valuation grade. The company is currently fairly valued, with a PE ratio of 133.60, an EV to EBITDA of 30.84, and a Price to Book Value of 0.52. In comparison with peers, Tata Chemicals has a PE ratio of 61.45 and an EV to EBITDA of 16.38, while SRF is categorized as very expensive with a PE ratio of 53.85 and an EV to EBITDA of 34.31.<BR><BR>Despite the fair valuation, Adani Enterprises has underperformed relative to the Sensex, with a year-to-date return of -4.36% compared to the Sensex's 6.81%. This underperformance, along with a notably high PE ratio, suggests that while the stock is currently fairly valued, it may still face challenges in achieving growth relative to its peers.

View full answer

Who are the top shareholders of the Adani Enterp.?

17-Jul-2025

The top shareholders of Adani Enterprises are the S.B. Adani Family Trust, holding 49.67%, followed by the Life Insurance Corporation of India with 4.16%. Other significant shareholders include foreign institutional investors at 11.71%, mutual funds at 2.49%, and individual investors at 3.13%.

The top shareholders of Adani Enterprises include the promoters, with Gautambhai Shantilal Adani and Rajeshbhai Shantilal Adani holding the largest stake through the S.B. Adani Family Trust, which accounts for 49.67% of the company. Additionally, the Life Insurance Corporation of India is the highest public shareholder, holding 4.16%. Mutual funds collectively hold 2.49% through 35 schemes, while foreign institutional investors (FIIs) own 11.71% across 452 FIIs. Individual investors hold 3.13% of the shares.

View full answer

What is the bonus history of the Adani Enterp.?

06-Jun-2025

Adani Enterprises issued a 1:1 bonus on December 10, 2009, allowing shareholders to double their holdings, with a record date of December 11, 2009.

Adani Enterprises has a bonus history that includes a notable event on December 10, 2009, when the company announced a 1:1 bonus issue. The record date for this bonus was December 11, 2009. This means that for every share held, shareholders received an additional share, effectively doubling their holdings at that time. If you have any more questions about Adani Enterprises or need further details, feel free to ask!

View full answer

Has Adani Enterp. declared dividend?

06-Jun-2025

Yes, Adani Enterprises Ltd has declared a dividend of 130% (₹1.3 per share) with an ex-date of June 13, 2025. Despite recent volatility, the company has shown strong long-term growth, particularly a total return of 1568.67% over the past five years.

Adani Enterprises Ltd has declared a dividend.<BR><BR>Dividend Details:<BR>- Percentage announced: 130%<BR>- Amount per share: 1.3<BR>- Ex-date: 13 Jun 25<BR><BR>Dividend Yield: 0.05%.<BR><BR>Total Returns by Period:<BR>Over the last 6 months, the price return was 1.56%, the dividend return was 0.05%, resulting in a total return of 1.61%.<BR><BR>In the past year, the price return was -20.21%, the dividend return was 0.08%, leading to a total return of -20.13%.<BR><BR>Over the last 2 years, the price return was 4.37%, the dividend return was 0.16%, resulting in a total return of 4.53%.<BR><BR>In the last 3 years, the price return was 14.2%, the dividend return was 0.23%, leading to a total return of 14.43%.<BR><BR>Over the past 4 years, the price return was 49.3%, the dividend return was 0.38%, resulting in a total return of 49.68%.<BR><BR>In the last 5 years, the price return was 1565.0%, the dividend return was 3.67%, leading to a total return of 1568.67%.<BR><BR>Overall, Adani Enterprises Ltd has declared a significant dividend, and while the recent total returns show volatility, particularly over the past year, the longer-term performance indicates strong growth, especially over the 5-year period.

View full answer
iScoreScore
Click here to find our call on this stock
Strong Sell
Sell
Hold
Buy
Strong Buy

Dashboard

1

Poor Management Efficiency with a low ROCE of 6.57%

  • The company has been able to generate a Return on Capital Employed (avg) of 6.57% signifying low profitability per unit of total capital (equity and debt)
2

Low ability to service debt as the company has a high Debt to EBITDA ratio of 7.62 times

3

Healthy long term growth as Net Sales has grown by an annual rate of 20.50% and Operating profit at 31.89%

 
4

Negative results in Mar 26

5

With ROCE of 4.5, it has a Expensive valuation with a 2.7 Enterprise value to Capital Employed

stock-summaryMojo Parameters

Mojo Parameters

Loading Valuation Snapshot...

Stock DNA

stock-summary
Industry

Diversified

stock-summary
Market cap

INR 386,362 Cr (Large Cap)

stock-summary
P/E

183.00

stock-summary
Industry P/E

92

stock-summary
Dividend Yield

0.08%

stock-summary
Debt Equity

1.14

stock-summary
Return on Equity

2.57%

stock-summary
Price to Book

4.69

Revenue and Profits:
Net Sales:
32,439 Cr
(Quarterly Results - Mar 2026)
Net Profit:
-221 Cr
stock-summaryTotal Returns
Total Returns (Price + Dividend) stock-summary
Dividend Yield (0.08%)
TimePeriod
Price Return
Dividend Return
Total Return
3 Months
51.5%
0.07%
51.57%
6 Months
30.28%
0.06%
30.34%
1 Year
22.27%
0.05%
22.32%
2 Years
-6.08%
0.08%
-6.0%
3 Years
23.32%
0.22%
23.54%
4 Years
40.32%
0.28%
40.6%
5 Years
99.28%
0.44%
99.72%

Latest dividend: 1.3 per share ex-dividend date: Jun-12-2026

Risk Adjusted Returns v/s stock-summary
Returns Beta
Icon
Beta has not been calculated since enough price history is not available
stock-summaryNews & Corporate Actions

News

P/E at 182.52 vs Industry's 92.12: What the Data Shows for Adani Enterprises Ltd

Valuation Premium and Its Implications

The striking premium in Adani Enterprises Ltd’s P/E ratio suggests investors are pricing in expectations far above the sector norm. At 182.52, the stock’s valuation is nearly 2x the industry average of 92.12, signalling either anticipated growth or elevated risk premiums. Such a disparity often reflects market confidence in the company’s future earnings potential or strategic positioning within the diversified sector. However, this premium also raises questions about sustainability, especially given the sector’s mixed recent results — with 7 positive, 6 flat, and 5 negative performances among 18 stocks reporting so ...

Read full news article
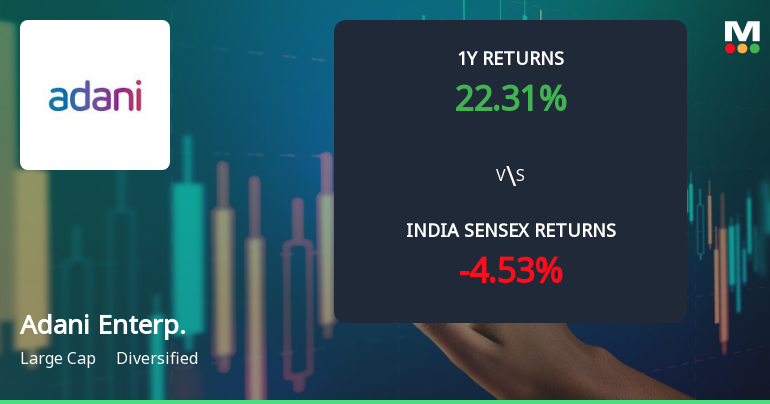
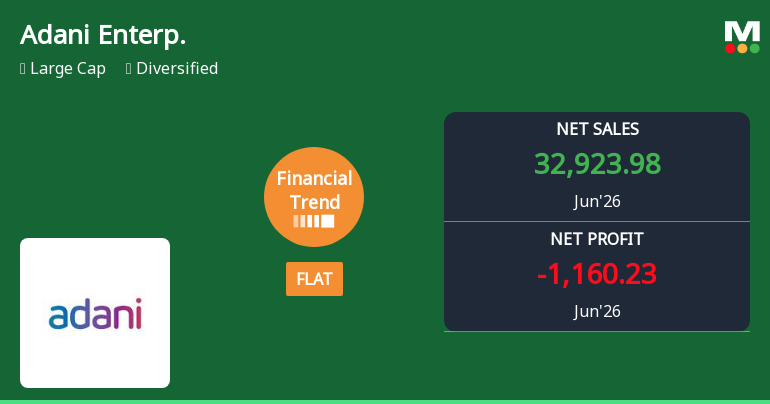
Announcements stock-summary

Announcement under Regulation 30 (LODR)-Acquisition

11-Jun-2026 | Source : BSE

Intimation of acquisition of Madhuvanti Build Estate Limited by AdaniConneX Private Limited a joint venture of the Company

Announcement under Regulation 30 (LODR)-Acquisition

10-Jun-2026 | Source : BSE

Intimation of completion of Acquisition of Portus Ventures Private Limited by Adani Airport City Limite a wholly owned step-down subsidiary of the Company

Intimation Of Entering To Into An Agreement For Acquisition Of 100% Equity Share Capital Of Portus Ventures Private Limited By Adani Airport City Limited A Wholly Owned Step-Down Subsidiary Of The Company

08-Jun-2026 | Source : BSE

Intimation for signing of Share Purchase Agreement by wholly owned step-down subsidiary of the Company.

Corporate Actions stock-summary

stock-summary
BOARD MEETING

No Upcoming Board Meetings

stock-summary
DIVIDEND

Adani Enterprises Ltd has declared 130% dividend, ex-date: 12 Jun 26

stock-summary
SPLITS

No Splits history available

stock-summary
BONUS

Adani Enterprises Ltd has announced 1:1 bonus issue, ex-date: 10 Dec 09

stock-summary
RIGHTS

Adani Enterprises Ltd has announced 3:25 rights issue, ex-date: 17 Nov 25

stock-summaryKey Factors

Quality key factors stock-summary

Factor
Value
Sales Growth (5y)
20.50%
EBIT Growth (5y)
31.89%
EBIT to Interest (avg)
1.48
Debt to EBITDA (avg)
7.35
Net Debt to Equity (avg)
1.14
Sales to Capital Employed (avg)
0.99
Tax Ratio
28.33%
Dividend Payout Ratio
1.80%
Pledged Shares
0.80%
Institutional Holding
17.50%
ROCE (avg)
6.71%
ROE (avg)
6.30%

Valuation key factors

Factor
Value
P/E Ratio
183
Industry P/E
92
Price to Book Value
4.69
EV to EBIT
60.12
EV to EBITDA
33.76
EV to Capital Employed
2.73
EV to Sales
4.70
PEG Ratio
NA
Dividend Yield
0.08%
ROCE (Latest)
4.53%
ROE (Latest)
2.57%

Technicals key factors

Indicator
Weekly
Monthly
MACD
Bullish
Bullish
RSI
No Signal
No Signal
Bollinger Bands
Mildly Bullish
Mildly Bullish
Moving Averages
Bullish (Daily)
KST
Bullish
Mildly Bullish
Dow Theory
No Trend
Mildly Bullish
OBV
Bullish
Bullish
stock-summary Technical Indicator Scale: Bearish, Mildly Bearish, Sideways, Mildly Bullish, Bullish  Turned 
stock-summaryShareholding
Shareholding Snapshot : Mar 2026stock-summary
Shareholding Compare (%holding) stock-summary
Majority shareholders

Promoters

Pledged Promoter Holdings

0.7977

Mutual Funds

Held by 36 Schemes (2.71%)

FIIs

Held by 461 FIIs (10.8%)

Promoter with highest holding

Gautambhai Shantilal Adani And Rajeshbhai Shantilal Adani (on Behalf Of S.b. Adani Family Trust) (49.67%)

Highest Public shareholder

Life Insurance Corporation Of India (3.64%)

Individual Investors Holdings

3.37%

stock-summaryFinancial
[
  {
    "link": "quarterly",
    "btn_text": "All Quarterly Results",
    "header": "Quarterly Results Snapshot (Consolidated) - Mar'26 - QoQ",
    "rhs": [
      {
        "prefix": "Net Sales ",
        "suffix": "QoQ Growth in quarter ended Mar 2026 is 30.70% vs 16.81% in Dec 2025",
        "dir": 1
      },
      {
        "prefix": "Consolidated Net Profit ",
        "suffix": "QoQ Growth in quarter ended Mar 2026 is -103.92% vs 75.91% in Dec 2025",
        "dir": -1
      }
    ],
    "table": {
      "header": [
        "Mar'26",
        "Dec'25",
        "Change(%)"
      ],
      "body": [
        {
          "field": "Net Sales",
          "val1": "32,439.31",
          "val2": "24,819.59",
          "chgp": "30.70%",
          "chgp_class": "positive"
        },
        {
          "field": "Operating Profit (PBDIT) excl Other Income",
          "val1": "3,730.75",
          "val2": "3,641.52",
          "chgp": "2.45%",
          "chgp_class": "positive"
        },
        {
          "field": "Interest",
          "val1": "1,646.48",
          "val2": "1,625.94",
          "chgp": "1.26%",
          "chgp_class": "negative"
        },
        {
          "field": "Exceptional Items",
          "val1": "0.00",
          "val2": "5,632.09",
          "chgp": "-100.00%",
          "chgp_class": "negative"
        },
        {
          "field": "Consolidate Net Profit",
          "val1": "-220.71",
          "val2": "5,627.02",
          "chgp": "-103.92%",
          "chgp_class": "negative"
        },
        {
          "field": "Operating Profit Margin (Excl OI)",
          "val1": "11.50%",
          "val2": "14.67%",
          "chgp": "-3.17%",
          "chgp_class": "negative"
        }
      ]
    }
  },
  {
    "link": "half-yearly",
    "btn_text": "All Half Yearly Results",
    "header": "Half Yearly Results Snapshot (Consolidated) - Sep'25",
    "rhs": [
      {
        "prefix": "Net Sales ",
        "suffix": " Growth in half year ended Sep 2025 is -10.13% vs 13.96% in Sep 2024",
        "dir": -1
      },
      {
        "prefix": "Consolidated Net Profit ",
        "suffix": " Growth in half year ended Sep 2025 is 23.06% vs 254.45% in Sep 2024",
        "dir": -1
      }
    ],
    "table": {
      "header": [
        "Sep'25",
        "Sep'24",
        "Change(%)"
      ],
      "body": [
        {
          "field": "Net Sales",
          "val1": "43,209.71",
          "val2": "48,080.47",
          "chgp": "-10.13%",
          "chgp_class": "negative"
        },
        {
          "field": "Operating Profit (PBDIT) excl Other Income",
          "val1": "6,616.85",
          "val2": "7,471.61",
          "chgp": "-11.44%",
          "chgp_class": "negative"
        },
        {
          "field": "Interest",
          "val1": "2,746.70",
          "val2": "2,040.32",
          "chgp": "34.62%",
          "chgp_class": "negative"
        },
        {
          "field": "Exceptional Items",
          "val1": "3,583.28",
          "val2": "-9.30",
          "chgp": "38,629.89%",
          "chgp_class": "positive"
        },
        {
          "field": "Consolidate Net Profit",
          "val1": "3,933.16",
          "val2": "3,196.25",
          "chgp": "23.06%",
          "chgp_class": "positive"
        },
        {
          "field": "Operating Profit Margin (Excl OI)",
          "val1": "15.31%",
          "val2": "15.54%",
          "chgp": "-0.23%",
          "chgp_class": "negative"
        }
      ]
    }
  },
  {
    "link": "nine-monthly",
    "btn_text": "All Nine Monthly Results",
    "header": "Nine Monthly Results Snapshot (Consolidated) - Dec'25",
    "rhs": [
      {
        "prefix": "Net Sales ",
        "suffix": "YoY Growth in nine months ended Dec 2025 is -4.09% vs 5.48% in Dec 2024",
        "dir": -1
      },
      {
        "prefix": "Consolidated Net Profit ",
        "suffix": "YoY Growth in nine months ended Dec 2025 is 193.79% vs 16.63% in Dec 2024",
        "dir": 1
      }
    ],
    "table": {
      "header": [
        "Dec'25",
        "Dec'24",
        "Change(%)"
      ],
      "body": [
        {
          "field": "Net Sales",
          "val1": "68,029.30",
          "val2": "70,928.89",
          "chgp": "-4.09%",
          "chgp_class": "negative"
        },
        {
          "field": "Operating Profit (PBDIT) excl Other Income",
          "val1": "10,258.37",
          "val2": "10,542.02",
          "chgp": "-2.69%",
          "chgp_class": "negative"
        },
        {
          "field": "Interest",
          "val1": "4,372.64",
          "val2": "4,181.64",
          "chgp": "4.57%",
          "chgp_class": "negative"
        },
        {
          "field": "Exceptional Items",
          "val1": "9,215.37",
          "val2": "-12.96",
          "chgp": "71,206.25%",
          "chgp_class": "positive"
        },
        {
          "field": "Consolidate Net Profit",
          "val1": "9,560.18",
          "val2": "3,254.08",
          "chgp": "193.79%",
          "chgp_class": "positive"
        },
        {
          "field": "Operating Profit Margin (Excl OI)",
          "val1": "15.08%",
          "val2": "14.86%",
          "chgp": "0.22%",
          "chgp_class": "positive"
        }
      ]
    }
  },
  {
    "link": "annual",
    "btn_text": "All Annual Results",
    "header": "Annual Results Snapshot (Consolidated) - Mar'26",
    "rhs": [
      {
        "prefix": "Net Sales ",
        "suffix": "YoY Growth in year ended Mar 2026 is 2.63% vs 1.53% in Mar 2025",
        "dir": 1
      },
      {
        "prefix": "Consolidated Net Profit ",
        "suffix": "YoY Growth in year ended Mar 2026 is 31.56% vs 119.05% in Mar 2025",
        "dir": -1
      }
    ],
    "table": {
      "header": [
        "Mar'26",
        "Mar'25",
        "Change(%)"
      ],
      "body": [
        {
          "field": "Net Sales",
          "val1": "1,00,468.61",
          "val2": "97,894.75",
          "chgp": "2.63%",
          "chgp_class": "positive"
        },
        {
          "field": "Operating Profit (PBDIT) excl Other Income",
          "val1": "13,989.12",
          "val2": "14,252.03",
          "chgp": "-1.84%",
          "chgp_class": "negative"
        },
        {
          "field": "Interest",
          "val1": "6,019.12",
          "val2": "5,978.02",
          "chgp": "0.69%",
          "chgp_class": "negative"
        },
        {
          "field": "Exceptional Items",
          "val1": "9,215.37",
          "val2": "3,932.77",
          "chgp": "134.32%",
          "chgp_class": "positive"
        },
        {
          "field": "Consolidate Net Profit",
          "val1": "9,339.47",
          "val2": "7,099.00",
          "chgp": "31.56%",
          "chgp_class": "positive"
        },
        {
          "field": "Operating Profit Margin (Excl OI)",
          "val1": "13.92%",
          "val2": "14.56%",
          "chgp": "-0.64%",
          "chgp_class": "negative"
        }
      ]
    }
  }
]

Quarterly Results Snapshot (Consolidated) - Mar'26 - QoQstock-summary

Mar'26
Dec'25
Change(%)
Net Sales
32,439.31
24,819.59
30.70%
Operating Profit (PBDIT) excl Other Income
3,730.75
3,641.52
2.45%
Interest
1,646.48
1,625.94
1.26%
Exceptional Items
0.00
5,632.09
-100.00%
Consolidate Net Profit
-220.71
5,627.02
-103.92%
Operating Profit Margin (Excl OI)
11.50%
14.67%
-3.17%
Values in Rs Cr.
Direction Arrows
Net Sales

QoQ Growth in quarter ended Mar 2026 is 30.70% vs 16.81% in Dec 2025

Direction Arrows
Consolidated Net Profit

QoQ Growth in quarter ended Mar 2026 is -103.92% vs 75.91% in Dec 2025

Half Yearly Results Snapshot (Consolidated) - Sep'25stock-summary

Sep'25
Sep'24
Change(%)
Net Sales
43,209.71
48,080.47
-10.13%
Operating Profit (PBDIT) excl Other Income
6,616.85
7,471.61
-11.44%
Interest
2,746.70
2,040.32
34.62%
Exceptional Items
3,583.28
-9.30
38,629.89%
Consolidate Net Profit
3,933.16
3,196.25
23.06%
Operating Profit Margin (Excl OI)
15.31%
15.54%
-0.23%
Values in Rs Cr.
Direction Arrows
Net Sales

Growth in half year ended Sep 2025 is -10.13% vs 13.96% in Sep 2024

Direction Arrows
Consolidated Net Profit

Growth in half year ended Sep 2025 is 23.06% vs 254.45% in Sep 2024

Nine Monthly Results Snapshot (Consolidated) - Dec'25stock-summary

Dec'25
Dec'24
Change(%)
Net Sales
68,029.30
70,928.89
-4.09%
Operating Profit (PBDIT) excl Other Income
10,258.37
10,542.02
-2.69%
Interest
4,372.64
4,181.64
4.57%
Exceptional Items
9,215.37
-12.96
71,206.25%
Consolidate Net Profit
9,560.18
3,254.08
193.79%
Operating Profit Margin (Excl OI)
15.08%
14.86%
0.22%
Values in Rs Cr.
Direction Arrows
Net Sales

YoY Growth in nine months ended Dec 2025 is -4.09% vs 5.48% in Dec 2024

Direction Arrows
Consolidated Net Profit

YoY Growth in nine months ended Dec 2025 is 193.79% vs 16.63% in Dec 2024

Annual Results Snapshot (Consolidated) - Mar'26stock-summary

Mar'26
Mar'25
Change(%)
Net Sales
1,00,468.61
97,894.75
2.63%
Operating Profit (PBDIT) excl Other Income
13,989.12
14,252.03
-1.84%
Interest
6,019.12
5,978.02
0.69%
Exceptional Items
9,215.37
3,932.77
134.32%
Consolidate Net Profit
9,339.47
7,099.00
31.56%
Operating Profit Margin (Excl OI)
13.92%
14.56%
-0.64%
Values in Rs Cr.
Direction Arrows
Net Sales

YoY Growth in year ended Mar 2026 is 2.63% vs 1.53% in Mar 2025

Direction Arrows
Consolidated Net Profit

YoY Growth in year ended Mar 2026 is 31.56% vs 119.05% in Mar 2025

stock-summaryCompany CV
About Adani Enterprises Ltd stock-summary
stock-summary
Adani Enterprises Ltd
Large Cap
Diversified
Adani Enterprises Limited was incorporated in March, 1992 with the name 'Adani Exports Limited'. Initially, the company started as a partnership firm in 1988, and attained joint stock company status in the year 1993. In April 1, 1993, the company was accorded the status of 'Star Trading House' by the Ministry of Commerce, Government of India. In April 1, 1994, they were accorded the status of 'Super Star Trading House' by the Ministry of Commerce, Government of India.
Company Coordinates stock-summary
Company Details
Adani Corporate House, Shantigram SG Highway Khodiyar Ahmedabad Gujarat : 382421
stock-summary
Tel: 91-79-26565555
stock-summary
info@adani.com
Registrar Details