
Compare Timken India with Similar Stocks
Stock DNA
Industrial Products
INR 28,441 Cr (Small Cap)
57.00
52
0.86%
-0.09
13.40%
9.54
Total Returns (Price + Dividend) 
Latest dividend: 36 per share ex-dividend date: Jul-25-2025
Risk Adjusted Returns v/s
Returns Beta

News
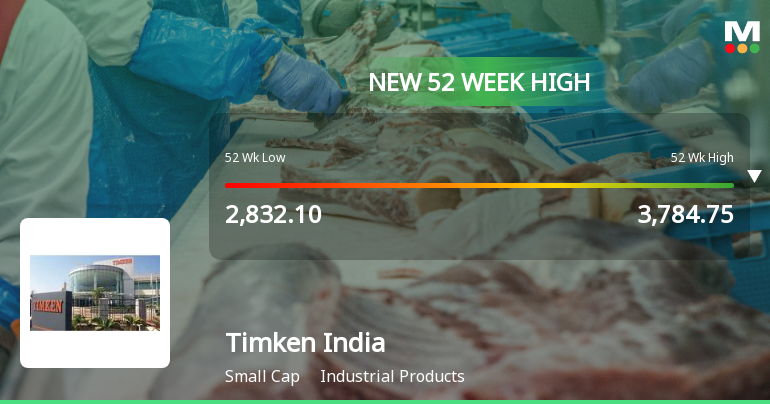
Broad-Based Technical Strength Lifts Timken India Ltd to 52-Week High of Rs 3784.75
With every major technical indicator aligned to the upside, Timken India Ltd surged to a fresh 52-week high of Rs 3784.75 on 22 Jun 2026, extending its recent momentum amid a broadly positive market backdrop.
Read full news article
Timken India Ltd is Rated Hold by MarketsMOJO
Timken India Ltd is rated 'Hold' by MarketsMOJO, with this rating last updated on 20 May 2026. However, the analysis and financial metrics discussed here reflect the stock's current position as of 19 June 2026, providing investors with the latest insights into its performance and outlook.
Read full news article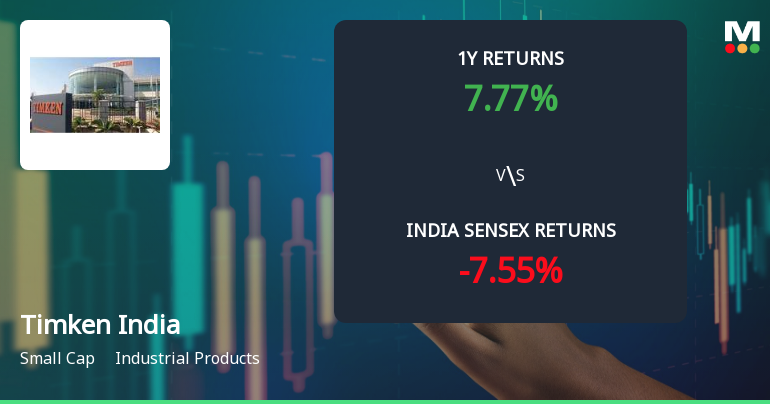
Timken India Ltd Technical Momentum Shifts to Bullish Amid Mixed Market Returns
Timken India Ltd has experienced a notable shift in its technical momentum, moving from a mildly bullish stance to a more confident bullish trend. This transition is underscored by positive signals from key technical indicators such as the MACD and moving averages, despite some mixed readings from other metrics. The stock’s recent price action and technical parameters suggest a strengthening momentum that investors should carefully analyse in the context of broader market performance and sector dynamics.
Read full news article Announcements
ORDER PASSED BY HONBLE HIGH COURT OF GUJARAT AT AHMEDABAD
22-Jun-2026 | Source : BSEPursuant to Regulation 30 of Securities and Exchange Board of India (Listing Obligations and Disclosure Requirements) Regulations 2015 we hereby inform about an Order passed by Honble High Court of Gujarat at Ahmedabad in the matter of Antifriction Bearings Corporation Limited (amalgamated with Timken India Limited) V/s Anil Ambalal Modi. For more details please see attachment.
Closure of Trading Window
19-Jun-2026 | Source : BSEIt may please be noted that in terms of provisions of Securities and Exchange Board of India (Prohibition of Insider Trading) Regulations 2015 read with Code of Conduct to Regulate Monitor and Report trading by Designated Persons and Insiders of the Company the trading window will be closed from 1 July 2026 till expiry of 48 hours of submission/publication of the Financial Results of the Company for quarter ending 30 June 2026 to stock exchanges after obtaining approval of the Board of Directors.
Announcement under Regulation 30 (LODR)-Newspaper Publication
04-Jun-2026 | Source : BSEPursuant to Regulation 30 of SEBI (Listing Obligations and Disclosure Requirements) Regulations 2015 we attach herewith copies of advertisements published in todays newspapers titled - Notice to Shareholders - Investor Education and Protection Fund Launch of Second 100 - Day Campaign - Saksham Niveshak and Special Window for Transfer and Demat of Physical Securities. The advertisement copies are also available on the Companys website at www.timken.com/en-in. Kindly request you to take this on record.
Corporate Actions

No Upcoming Board Meetings

Timken India Ltd has declared 360% dividend, ex-date: 25 Jul 25

No Splits history available

No Bonus history available

No Rights history available
Quality key factors
Valuation key factors
Technicals key factors
 Technical Indicator Scale: Bearish, Mildly Bearish, Sideways, Mildly Bullish, Bullish Turned
 Shareholding Snapshot : Mar 2026
Shareholding Compare (%holding)
Promoters
None
Held by 28 Schemes (25.88%)
Held by 127 FIIs (6.96%)
Timken Singapore Pte Ltd (51.05%)
Hdfc Mutual Fund - Hdfc Mid-cap Fund (7.94%)
8.41%
Quarterly Results Snapshot (Standalone) - Mar'26 - QoQ

QoQ Growth in quarter ended Mar 2026 is 40.39% vs -1.11% in Dec 2025
QoQ Growth in quarter ended Mar 2026 is 210.51% vs -44.28% in Dec 2025
Half Yearly Results Snapshot (Standalone) - Sep'25

Growth in half year ended Sep 2025 is 2.94% vs 9.79% in Sep 2024
Growth in half year ended Sep 2025 is 3.99% vs 1.68% in Sep 2024
Nine Monthly Results Snapshot (Standalone) - Dec'25
YoY Growth in nine months ended Dec 2025 is 6.26% vs 9.75% in Dec 2024
YoY Growth in nine months ended Dec 2025 is -6.53% vs 3.93% in Dec 2024
Annual Results Snapshot (Standalone) - Mar'26
YoY Growth in year ended Mar 2026 is 8.63% vs 8.19% in Mar 2025
YoY Growth in year ended Mar 2026 is -10.97% vs 14.09% in Mar 2025
About Timken India Ltd

Company Coordinates


