
Compare Deccan Polypacks with Similar Stocks
Dashboard
With a Negative Book Value, the company has a Weak Long Term Fundamental Strength
- Poor long term growth as Net Sales has grown by an annual rate of % and Operating profit at 0% over the last 5 years
- The company has a negative book value of Rs 13.64 crore
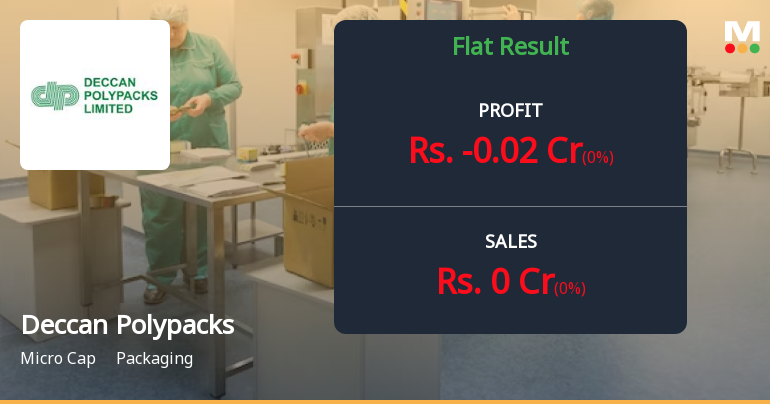
Flat results in Mar 26
Risky - Negative EBITDA
Total Returns (Price + Dividend) 
Deccan Polypacks for the last several years.
Risk Adjusted Returns v/s
Returns Beta

News
Deccan Polypacks Q1 FY27: Operational Standstill Raises Serious Viability Concerns
Deccan Polypacks Ltd., the Hyderabad-based packaging manufacturer, continues to report zero sales for Q1 FY27 (Mar'26 quarter), extending a concerning pattern of operational inactivity that has persisted across multiple quarters. The company posted a net loss of ₹0.02 crores for the quarter, whilst maintaining a micro-cap market capitalisation of just ₹7.00 crores. Despite the operational standstill, the stock surged 4.98% on July 01, 2026, trading at ₹33.91, though this movement appears disconnected from fundamental business performance.
Read full news articleWhen is the next results date for Deccan Polypacks Ltd?
Deccan Polypacks Ltd is scheduled to declare its results on 29 May 2026....
Read full news article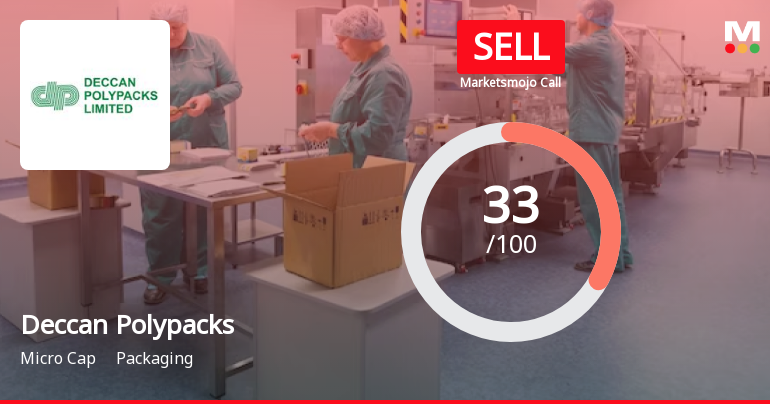
Deccan Polypacks Ltd Upgraded to Sell on Technical Improvements Despite Weak Fundamentals
Deccan Polypacks Ltd has seen its investment rating upgraded from Strong Sell to Sell as of 9 April 2026, driven primarily by a shift in technical indicators despite persistent fundamental weaknesses. The packaging company’s Mojo Score rose to 33.0, reflecting a mildly bullish technical outlook, although its financial and quality metrics remain under pressure.
Read full news article Announcements
Results-Delay in Financial Results
29-Jun-2026 | Source : BSEQuarterly Financial results for theQ.E.31.03.2026
Announcement under Regulation 30 (LODR)-Change in Management
29-Jun-2026 | Source : BSEMrs. D Sakuntala Cessation as Chief Financial Officer (CFO)accepted and she was appointed as Chief Executive Officer (CEO)of the Company W.e.f.29-06-2026
Closure of Trading Window
24-Jun-2026 | Source : BSEIntimation of Trading Window Closure for Q.E.30.06.2026
Corporate Actions

No Upcoming Board Meetings

No Dividend history available

No Splits history available

No Bonus history available

No Rights history available
Quality key factors
Valuation key factors
Technicals key factors
 Technical Indicator Scale: Bearish, Mildly Bearish, Sideways, Mildly Bullish, Bullish Turned
 Shareholding Snapshot : Mar 2026
Shareholding Compare (%holding)
Non Institution
19.0033
Held by 0 Schemes
Held by 0 FIIs
D V Prudvi Raju (3.49%)
D Sakuntala (6.58%)
85.86%
Quarterly Results Snapshot (Standalone) - Mar'26 - QoQ
QoQ Growth in quarter ended Mar 2026 is 0.00% vs 0.00% in Dec 2025

QoQ Growth in quarter ended Mar 2026 is 0.00% vs 33.33% in Dec 2025
Half Yearly Results Snapshot (Standalone) - Sep'25
Growth in half year ended Sep 2025 is 0.00% vs 0.00% in Sep 2024
Growth in half year ended Sep 2025 is -3,100.00% vs 0.00% in Sep 2024
Nine Monthly Results Snapshot (Standalone) - Dec'25
YoY Growth in nine months ended Dec 2025 is 0.00% vs 0.00% in Dec 2024
YoY Growth in nine months ended Dec 2025 is -1,600.00% vs -100.00% in Dec 2024
Annual Results Snapshot (Standalone) - Mar'26
YoY Growth in year ended Mar 2026 is 0.00% vs 0.00% in Mar 2025
YoY Growth in year ended Mar 2026 is -139.56% vs 1,920.00% in Mar 2025
About Deccan Polypacks Ltd

Company Coordinates


