
Compare N K Industries with Similar Stocks
Dashboard
With a Negative Book Value, the company has a Weak Long Term Fundamental Strength
- Poor long term growth as Net Sales has grown by an annual rate of -6.59% and Operating profit at 0% over the last 5 years
- The company has a negative book value of Rs 351.02 crore
Flat results in Dec 25
Risky - Negative EBITDA
Underperformed the market in the last 1 year
Stock DNA
Edible Oil
INR 35 Cr (Micro Cap)
NA (Loss Making)
29
0.00%
0.00
0.00%
-0.12
Total Returns (Price + Dividend) 
N K Industries for the last several years.
Risk Adjusted Returns v/s
Returns Beta

News
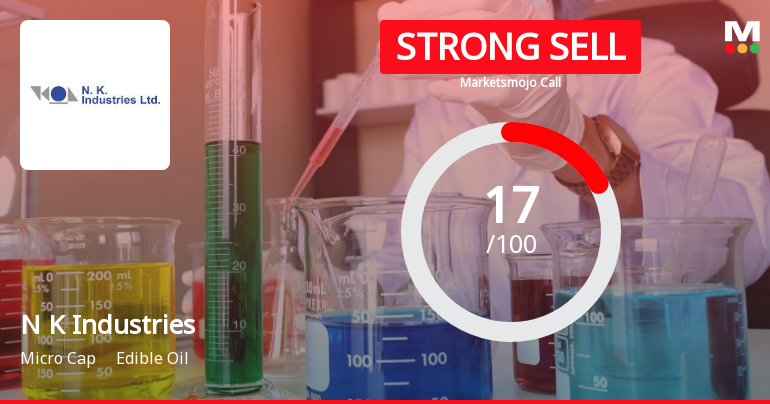
N K Industries Ltd is Rated Strong Sell
N K Industries Ltd is rated Strong Sell by MarketsMOJO, with this rating last updated on 14 Oct 2025. However, the analysis and financial metrics discussed here reflect the stock’s current position as of 26 May 2026, providing investors with the latest insights into the company’s performance and outlook.
Read full news articleWhen is the next results date for N K Industries Ltd?
The next results date for N K Industries Ltd is scheduled for 27 May 2026....
Read full news article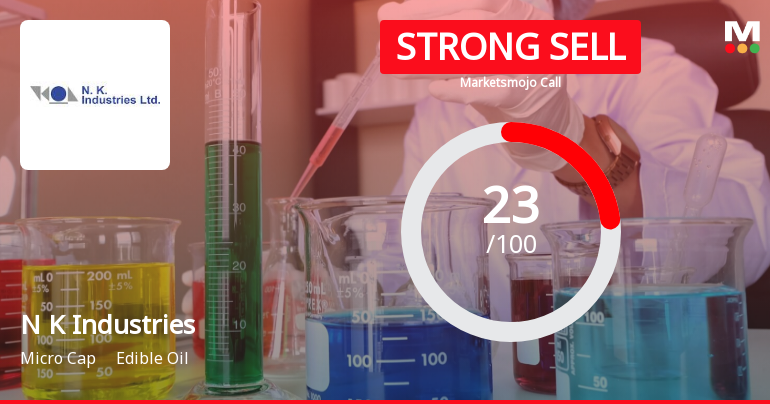
N K Industries Ltd is Rated Strong Sell
N K Industries Ltd is rated 'Strong Sell' by MarketsMOJO, with this rating last updated on 14 Oct 2025. However, the analysis and financial metrics discussed here reflect the stock's current position as of 12 May 2026, providing investors with an up-to-date perspective on the company’s performance and outlook.
Read full news article Announcements
Board Meeting Intimation for Intimation Of Board Meeting For Audited Financial Results For The Quarter & Year Ended On 31St March 2026 Ref: Regulations 29 And 50 Of SEBI (Listing Obligations And Disclosure Requirements) Regulations 2015
21-May-2026 | Source : BSENK Industries Ltdhas informed BSE that the meeting of the Board of Directors of the Company is scheduled on 27/05/2026 inter alia to consider and approve It is hereby informed that in terms of above referred Regulations the Meeting of the Board of Directors of the Company has been scheduled on Wednesday 27th May 2026 inter alia to consider the following agenda: 1. To consider and approve the Audited Financial Results (Both Standalone & Consolidated) for the quarter & financial year ended on 31st March 2026. 2. Any other business as may be considered fit and proper by the Chair.
Format of the Initial Disclosure to be made by an entity identified as a Large Corporate : Annexure A
13-Apr-2026 | Source : BSEFormat of Initial Disclosure to be made by an entity identified as a Large Corporate.
| Sr. No. | Particulars | Details |
| 1 | Name of Company | NK Industries Ltd |
| 2 | CIN NO. | L91110GJ1987PLC009905 |
| 3 | Outstanding borrowing of company as on 31st March / 31st December as applicable (in Rs cr) | 0.00 |
| 4 | Highest Credit Rating during the previous FY | 0 |
| 4a | Name of the Credit Rating Agency issuing the Credit Rating mentioned in (4) | Not Applicable |
| 5 | Name of Stock Exchange# in which the fine shall be paid in case of shortfall in the required borrowing under the framework | BSE |
Designation: Company Secretary and Compliance Officer
EmailId: nkil@nkproteins.com
Designation: CFO
EmailId: nkil@nkproteins.com
Date: 13/04/2026
Note: In terms para of 3.2(ii) of the circular beginning F.Y 2022 in the event of shortfall in the mandatory borrowing through debt securities a fine of 0.2% of the shortfall shall be levied by Stock Exchanges at the end of the two-year block period. Therefore an entity identified as LC shall provide in its initial disclosure for a financial year the name of Stock Exchange to which it would pay the fine in case of shortfall in the mandatory borrowing through debt markets.
Compliances-Certificate under Reg. 74 (5) of SEBI (DP) Regulations 2018
13-Apr-2026 | Source : BSEPlease find enclosed herewith the Certificate dated 1st April 2026 under Regulation 74(5) of the SEBI (Depositories and Participants) Regulations 2018 for the quarter and year ended 31st March 2026 received from M/s. MUFG Intime India Pvt. Ltd. (formerly known as Link Intime India Private Limited) (SEBI Registration Number INR000004058) Registrar and Share Transfer Agents of the Company.
Corporate Actions

27 May 2026

No Dividend history available

No Splits history available

No Bonus history available

No Rights history available
Quality key factors
Valuation key factors
Technicals key factors
 Technical Indicator Scale: Bearish, Mildly Bearish, Sideways, Mildly Bullish, Bullish Turned
 Shareholding Snapshot : Mar 2026
Shareholding Compare (%holding)
Promoters
None
Held by 0 Schemes
Held by 0 FIIs
Aashita Nileshbhai Patel (21.2%)
Bhavna Darshan Mehta (2.48%)
24.91%
Quarterly Results Snapshot (Consolidated) - Dec'25 - QoQ

QoQ Growth in quarter ended Dec 2025 is -24.02% vs -8.67% in Sep 2025

QoQ Growth in quarter ended Dec 2025 is 60.10% vs -194.20% in Sep 2025
Half Yearly Results Snapshot (Consolidated) - Sep'25
Growth in half year ended Sep 2025 is -10.39% vs -10.19% in Sep 2024
Growth in half year ended Sep 2025 is -491.30% vs 68.71% in Sep 2024
Nine Monthly Results Snapshot (Consolidated) - Dec'25
YoY Growth in nine months ended Dec 2025 is -16.43% vs -11.12% in Dec 2024
YoY Growth in nine months ended Dec 2025 is -296.63% vs 52.41% in Dec 2024
Annual Results Snapshot (Consolidated) - Mar'25
YoY Growth in year ended Mar 2025 is -14.76% vs 8.53% in Mar 2024
YoY Growth in year ended Mar 2025 is -244.66% vs 44.62% in Mar 2024
About N K Industries Ltd

Company Coordinates


