Aplab

  • Market Cap: Micro Cap
  • Industry: Other Electrical Equipment
  • ISIN: INE273A01015
  • NSEID: APLAB
  • BSEID: 517096
INR
63.89
0.68 (1.08%)
BSENSE

Jan 30

BSE+NSE Vol: 7.33 k

  • Price Points
  • Score
  • Mojo Parameters
  • Total Return
  • News and Corporate Actions
  • Key factors
  • Shareholding
  • Financials
  • CompanyCV
stock-summaryPrice Point
High/Low

1Day

52 Week

Valuation
Technical
Day's Volume

CASH

7.33 k (44.71%) Volume

Shareholding (Dec 2025)

FII

0.00%

Held by 0 FIIs

DII

0.00%

Held by 0 DIIs

Promoter

43.83%

Who are in the management team of Aplab?

06-Jun-2025

As of March 2022, Aplab's management team includes P S Deodhar (Chairman & Managing Director), S K Hajela (Non-Executive & Independent Director), Rajesh K Deherkar (Company Secretary & Compliance Officer), Amrita P Deodhar (Director), and Sanjay N Mehta (Additional Director). They oversee the company's operations and strategic direction.

As of March 2022, the management team of Aplab includes the following individuals:<BR><BR>1. P S Deodhar - Chairman & Managing Director<BR>2. S K Hajela - Non-Executive & Independent Director<BR>3. Rajesh K Deherkar - Company Secretary & Compliance Officer<BR>4. Amrita P Deodhar - Director<BR>5. Sanjay N Mehta - Additional Director<BR><BR>This team is responsible for overseeing the company's operations and strategic direction.

View full answer

When is the next results date for Aplab?

06-Jun-2025

No Upcoming Board Meetings

Has Aplab declared dividend?

06-Jun-2025

Aplab Ltd has declared a 10% dividend, amounting to 1.0000 per share, with an ex-date of June 16, 2009. However, the dividend yield is 0%, and total returns have varied significantly over different periods, with a notable increase of 798.17% over the past five years despite no recent dividends.

Aplab Ltd has declared a 10% dividend.<BR><BR>Dividend Details:<BR>- Percentage announced: 10%<BR>- Amount per share: 1.0000<BR>- Ex-date: Jun-16-2009<BR><BR>Dividend Yield: 0%<BR><BR>Total Returns by Period:<BR>In the 6-month period, the price return was -47.1%, the dividend return was 0%, resulting in a total return of -47.1%.<BR><BR>In the 1-year period, the price return was -41.68%, the dividend return was 0%, leading to a total return of -41.68%.<BR><BR>In the 2-year period, the price return was 21.86%, the dividend return was 0%, resulting in a total return of 21.86%.<BR><BR>In the 3-year period, the price return was 65.48%, the dividend return was 0%, leading to a total return of 65.48%.<BR><BR>In the 4-year period, the price return was 72.94%, the dividend return was 0%, resulting in a total return of 72.94%.<BR><BR>In the 5-year period, the price return was 798.17%, the dividend return was 0%, leading to a total return of 798.17%.<BR><BR>Overall, Aplab Ltd has declared a dividend, but the dividend yield remains at 0%. The total returns over various periods show significant fluctuations, particularly a strong performance over the 5-year period, despite the lack of dividends in recent years.

View full answer

Who are the peers of the Aplab?

03-Jun-2025

Aplab's peers include Waaree Energies, Premier Energies, Apar Inds., Genus Power, Websol Energy, Gujarat Poly, Relicab Cable, Alfa Transformer, and Sungarner Energ. Among these, Waaree Energies and Premier Energies show excellent management and growth, while Aplab has the lowest 1-year return at -37.17%.

Peers: The peers of Aplab are Waaree Energies, Premier Energies, Apar Inds., Genus Power, Websol Energy, Gujarat Poly, Relicab Cable, Alfa Transformer, and Sungarner Energ.<BR><BR>Quality Snapshot: Excellent management risk is observed at Premier Energies, while Good management risk is found at Waaree Energies and Apar Inds., and the rest have Average or Below Average ratings. For Growth, Excellent growth is noted at Waaree Energies, Premier Energies, and Sungarner Energ., while Average growth is found at Websol Energy and Genus Power, and the rest have Below Average ratings. In terms of Capital Structure, Excellent capital structure is seen at Waaree Energies and Premier Energies, while Good capital structure is found at Apar Inds. and Genus Power, and the rest have Below Average ratings.<BR><BR>Return Snapshot: Websol Energy has the highest 1-year return at 136.44%, while Aplab has the lowest at -37.17%, indicating a significant negative performance compared to its peers. Additionally, several peers, including Relicab Cable, Alfa Transformer, and Aplab, have negative six-month returns.

View full answer

Is Aplab overvalued or undervalued?

09-Jun-2025

As of February 11, 2025, Aplab's valuation has shifted to risky due to its high PE ratio of 113.53, negative EV to EBITDA of -17.25, low ROE of 2.21%, and poor stock performance with a year-to-date return of -48.08%, indicating it is overvalued compared to peers like Kaynes Tech and Honeywell Auto.

As of 11 February 2025, Aplab's valuation grade has moved from fair to risky, indicating a significant shift in its perceived value. The company appears to be overvalued, particularly when considering its high PE ratio of 113.53 and negative EV to EBITDA of -17.25, which suggest that investors are paying a premium for its earnings potential that is not currently being realized. Additionally, the ROE stands at a low 2.21%, further highlighting concerns about profitability.<BR><BR>In comparison to its peers, Aplab's valuation metrics are starkly unfavorable. For instance, Kaynes Tech has a PE ratio of 125.17 and an EV to EBITDA of 89.08, while Honeywell Auto shows a PE of 65.93 and an EV to EBITDA of 54.27, both of which are lower than Aplab's metrics. The company's recent stock performance has been poor, with a year-to-date return of -48.08%, contrasting sharply with the Sensex's gain of 5.66% during the same period, reinforcing the notion that Aplab is currently overvalued in the market.

View full answer

What is the technical trend for Aplab?

09-Jun-2025

As of May 29, 2025, Aplab's technical trend is mildly bearish, indicated by mixed signals from MACD, RSI, Bollinger Bands, and moving averages, suggesting a prevailing bearish sentiment in the short to medium term.

As of 29 May 2025, the technical trend for Aplab has changed from sideways to mildly bearish. The current stance is mildly bearish, driven by several key indicators. The MACD shows a mildly bullish signal on the weekly chart but is mildly bearish on the monthly chart. The RSI presents no signal on the weekly timeframe while being bullish on the monthly. However, Bollinger Bands and moving averages indicate bearish trends on both daily and weekly charts. Additionally, Dow Theory supports a mildly bearish outlook on both weekly and monthly timeframes. Overall, the mixed signals suggest a prevailing bearish sentiment in the short to medium term.

View full answer

What does Aplab do?

17-Jul-2025

Aplab Ltd designs, manufactures, and markets professional electronic equipment and power systems, classified as a Micro Cap company. As of March 2025, it reported net sales of 239 Cr and a net profit of 70 Cr.

Overview:<BR>Aplab Ltd specializes in designing, developing, manufacturing, and marketing high-quality professional electronic equipment and power systems, operating within the Other Electrical Equipment industry and classified as a Micro Cap company.<BR><BR>History:<BR>Aplab Ltd was incorporated in September 1964 and was previously known as Applied Electronics Ltd. The latest quarterly results reported net sales and net profit for the period ending March 2025.<BR><BR>Financial Snapshot:<BR>Net Sales: 239 Cr (Quarterly Results - Mar 2025) <BR>Net Profit: 70 Cr (Quarterly Results - Mar 2025) <BR>Market Cap: INR 59 Cr (Micro Cap)<BR><BR>Key Metrics:<BR>P/E: 59.00 <BR>Industry P/E: 75 <BR>Dividend Yield: 0.00% <BR>Debt-Equity: 2.06 <BR>Return on Equity: 2.21% <BR>Price to Book: 5.02 <BR><BR>Contact Details:<BR>Address: Aplab House, A-5 Wagle Industrial Estate Thane Maharashtra : 400604 <BR>Tel: 022-67395555/67395588 <BR>Email: response@aplab.com <BR>Website: http://www.aplab.com

View full answer

Who are the top shareholders of the Aplab?

17-Jul-2025

The top shareholders of Aplab include Amrita Prabhakar Deodhar with 35.27%, individual investors with 55.91%, and the highest public shareholder, Poonam Balram Bharwani, at 4.43%. Promoter holdings are partially pledged at 26.63%, while mutual funds hold 0.01% and there are no foreign institutional investors.

The top shareholders of Aplab include Amrita Prabhakar Deodhar, who holds the highest promoter stake at 35.27%. Additionally, individual investors collectively hold 55.91% of the shares. The highest public shareholder is Poonam Balram Bharwani, with a stake of 4.43%. The company also has pledged promoter holdings at 26.6261%, while mutual funds hold a minimal stake of 0.01% across four schemes, and there are currently no foreign institutional investors (FIIs) involved.

View full answer

How big is Aplab?

24-Jul-2025

As of 24th July, Aplab Ltd has a market capitalization of 59.00 Cr and reported net sales of 137.57 Cr with a net profit of 0.85 Cr over the latest three quarters. The balance sheet shows shareholder's funds at a loss of 4.89 Cr and total assets valued at 133.67 Cr.

As of 24th July, Aplab Ltd has a market capitalization of 59.00 Cr, categorizing it as a Micro Cap company.<BR><BR>In the latest quarterly performance, Aplab reported net sales of 137.57 Cr for the sum of the latest three quarters. The net profit for the same period was 0.85 Cr.<BR><BR>The balance sheet snapshot for the reporting period of March 2016 shows shareholder's funds at a loss of 4.89 Cr and total assets valued at 133.67 Cr.

View full answer

How has been the historical performance of Aplab?

04-Nov-2025

Aplab has experienced a significant decline in net sales and profitability over the years, with losses increasing from -14.21 Cr in Mar'15 to -17.57 Cr in Mar'16, alongside negative cash flow and rising liabilities.

Answer:<BR>The historical performance of Aplab shows a declining trend in net sales and profitability over the years, with significant losses reported in recent years.<BR><BR>Breakdown:<BR>Aplab's net sales decreased from 116.04 Cr in Mar'10 to 71.10 Cr in Mar'16, reflecting a downward trend. The total operating income followed a similar pattern, dropping from 100.05 Cr in Mar'10 to 71.10 Cr in Mar'16. The company faced increasing raw material costs, which were 41.26 Cr in Mar'16, slightly up from 41.24 Cr in Mar'15, while employee costs decreased from 20.44 Cr in Mar'15 to 18.07 Cr in Mar'16. Operating profit (PBDIT) turned negative, with a loss of 4.44 Cr in Mar'16 compared to a loss of 1.53 Cr in Mar'15. The profit before tax also worsened, showing a loss of 17.57 Cr in Mar'16, compared to a loss of 14.16 Cr in Mar'15. Consequently, the profit after tax was -17.57 Cr in Mar'16, down from -14.21 Cr in Mar'15. The company's total liabilities increased to 133.67 Cr in Mar'16 from 128.31 Cr in Mar'15, while total assets rose slightly to 133.67 Cr in Mar'16 from 128.31 Cr in Mar'15. Cash flow from operating activities remained negative at -5.00 Cr in Mar'16, indicating ongoing cash flow challenges. Overall, Aplab's financial performance has deteriorated significantly over the years, with increasing losses and declining sales.

View full answer

Are Aplab Ltd latest results good or bad?

20-Jan-2026

Aplab Ltd's latest results are concerning, showing a 34.93% decline in net sales and a 51.55% drop in net profit, reflecting ongoing financial struggles and high debt. The outlook remains bleak due to persistent losses and negative shareholder equity.

Aplab Ltd's latest results indicate a troubling trend. The company reported a significant decline in net sales, with a quarter-on-quarter decrease of 34.93% in the December 2025 quarter compared to the previous quarter. Additionally, standalone net profit also fell sharply by 51.55%, reflecting a deterioration in financial performance.<BR><BR>This decline follows a longer-term pattern of financial distress for Aplab, characterized by persistent losses and negative shareholder equity. The company's operational challenges are compounded by a high debt burden, which has raised concerns about its viability as a going concern. <BR><BR>Overall, the latest results are indicative of a company that continues to struggle significantly, and the outlook remains bleak given the ongoing financial issues and lack of positive momentum.

View full answer

Why is Aplab Ltd falling/rising?

29-Jan-2026

As of 29-Jan, Aplab Ltd's stock price is at 63.17, reflecting a decline of 4.99%. The stock has significantly underperformed, with a 19.87% drop over the past month and low investor participation, indicating a bearish trend.

As of 29-Jan, Aplab Ltd's stock price is falling, currently at 63.17, which reflects a change of -3.32 (-4.99%). The stock has been underperforming significantly, with a decline of 4.00% over the past week, while the benchmark Sensex has increased by 0.31%. Over the past month, Aplab Ltd has experienced a substantial drop of 19.87%, compared to a smaller decline of 2.51% in the Sensex.<BR><BR>Today's performance indicates that the stock has underperformed its sector by 6.49% and has been on a consecutive decline for the last two days, accumulating a total loss of 8.87% during this period. The stock reached an intraday high of Rs 69 but fell to a low of Rs 63.17, indicating significant volatility. Additionally, Aplab Ltd is trading below its 5-day, 20-day, 50-day, 100-day, and 200-day moving averages, which suggests a bearish trend.<BR><BR>Investor participation has also decreased, with the delivery volume on 28 January falling by 17.86% compared to the 5-day average. This decline in trading activity further supports the downward movement in the stock price. Overall, the combination of poor recent performance, low investor participation, and trading below key moving averages contributes to the falling stock price of Aplab Ltd.

View full answer

Should I buy, sell or hold Aplab Ltd?

30-Jan-2026
iScoreScore
Click here to find our call on this stock
Strong Sell
Sell
Hold
Buy
Strong Buy

MarketsMojo — Loved in India, Now Global

The power of Mojo is now in 29 countries. Explore global equities with the same cutting-edge features you love.

Dashboard

1

Weak Long Term Fundamental Strength with a -15.70% CAGR growth in Operating Profits over the last 5 years

  • Low ability to service debt as the company has a high Debt to EBITDA ratio of 15.42 times
2

With ROCE of -11.6, it has a Very Expensive valuation with a 2.4 Enterprise value to Capital Employed

3

Underperformed the market in the last 1 year

stock-summaryMojo Parameters

Mojo Parameters

Loading Valuation Snapshot...

Stock DNA

stock-summary
Industry

Other Electrical Equipment

stock-summary
Market cap

INR 83 Cr (Micro Cap)

stock-summary
P/E

8.00

stock-summary
Industry P/E

49

stock-summary
Dividend Yield

0.00%

stock-summary
Debt Equity

1.31

stock-summary
Return on Equity

54.36%

stock-summary
Price to Book

4.20

Revenue and Profits:
Net Sales:
11 Cr
(Quarterly Results - Dec 2025)
Net Profit:
1 Cr
stock-summaryTotal Returns
Total Returns (Price + Dividend) stock-summary
Dividend Yield (0%)
TimePeriod
Price Return
Dividend Return
Total Return
3 Months
-26.56%
0%
-26.56%
6 Months
41.66%
0%
41.66%
1 Year
-15.62%
0%
-15.62%
2 Years
-28.0%
0%
-28.0%
3 Years
223.49%
0%
223.49%
4 Years
133.18%
0%
133.18%
5 Years
235.38%
0%
235.38%

Latest dividend: 1.0000 per share ex-dividend date: Jun-16-2009

Risk Adjusted Returns v/s stock-summary
Returns Beta
Icon
Beta has not been calculated since enough price history is not available
stock-summaryNews & Corporate Actions

News

Why is Aplab Ltd falling/rising?

Recent Price Movement and Market Context

Although Aplab’s stock price rose by ₹0.68 on the day, this gain came against a backdrop of underperformance over multiple time frames. Over the past week, the stock has declined by 6.37%, sharply contrasting with the Sensex’s 0.90% gain. The one-month and year-to-date returns for Aplab stand at -15.68% and -15.12% respectively, both considerably worse than the Sensex’s corresponding declines of -2.84% and -3.46%. Over the last year, the stock has fallen 15.62%, while the Sensex has appreciated by 7.18%. This divergence highlights the stock’s ongoing struggle to keep pace with the broader market.

On the day in question, the Electronics - Components sector gained 2.86%, yet Aplab underperformed its sector peers by 1.77%. The stoc...

Read full news article
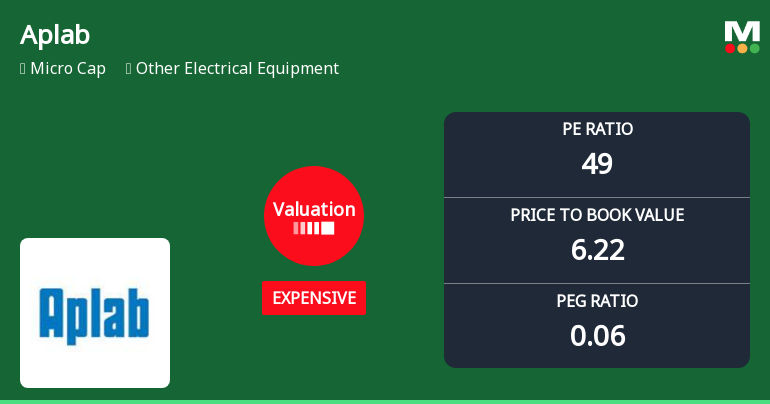
Announcements stock-summary

Results-Financial Results For The 3Rd Quarter And Nine Months Ended 31St December 2025

19-Jan-2026 | Source : BSE

Approval of Un-audited financial results for the 3rd quarter and nine month ended 31st December 2025

Board Meeting Outcome for Outcome Of Board Meeting Dated 19Th Janaury 2026

19-Jan-2026 | Source : BSE

Outcome of Board Meeting dated 19th January 2026 for approval of un-audited financial results for the 3rd quarter and nine month ended 31st December 2025 and other matters

For Appointment Of Additional Director Mr. Suresh S. Shah As Independent Director Of The Company

19-Jan-2026 | Source : BSE

Approval of Appointment of Mr. Suresh S. Shah as Additional Director designated as Independent Director of the Company for 5 years w.e.f. 19th January 2026.

Corporate Actions stock-summary

stock-summary
BOARD MEETING

No Upcoming Board Meetings

stock-summary
DIVIDEND

Aplab Ltd has declared 10% dividend, ex-date: 16 Jun 09

stock-summary
SPLITS

No Splits history available

stock-summary
BONUS

No Bonus history available

stock-summary
RIGHTS

Aplab Ltd has announced 1:1 rights issue, ex-date: 29 May 25

stock-summaryKey Factors

Quality key factors stock-summary

Factor
Value
Sales Growth (5y)
6.89%
EBIT Growth (5y)
-15.70%
EBIT to Interest (avg)
0.82
Debt to EBITDA (avg)
5.46
Net Debt to Equity (avg)
1.31
Sales to Capital Employed (avg)
1.53
Tax Ratio
Tax Ratio is Negative%
Dividend Payout Ratio
0
Pledged Shares
22.69%
Institutional Holding
0.01%
ROCE (avg)
10.83%
ROE (avg)
26.54%

Valuation key factors

Factor
Value
P/E Ratio
8
Industry P/E
49
Price to Book Value
4.25
EV to EBIT
35.59
EV to EBITDA
30.70
EV to Capital Employed
2.41
EV to Sales
1.54
PEG Ratio
0.03
Dividend Yield
NA
ROCE (Latest)
-11.58%
ROE (Latest)
54.36%

Technicals key factors

Indicator
Weekly
Monthly
MACD
Mildly Bearish
Bullish
RSI
No Signal
No Signal
Bollinger Bands
Bearish
Bearish
Moving Averages
Mildly Bullish (Daily)
KST
Mildly Bearish
Mildly Bearish
Dow Theory
Mildly Bearish
Mildly Bearish
stock-summary Technical Indicator Scale: Bearish, Mildly Bearish, Sideways, Mildly Bullish, Bullish  Turned 
stock-summaryShareholding
Shareholding Snapshot : Dec 2025stock-summary
Shareholding Compare (%holding) stock-summary
Majority shareholders

Non Institution

Pledged Promoter Holdings

22.6875

Mutual Funds

Held by 4 Schemes (0.01%)

FIIs

Held by 0 FIIs

Promoter with highest holding

Amrita Prabhakar Deodhar (35.27%)

Highest Public shareholder

Poonam Balram Bharwani (4.65%)

Individual Investors Holdings

49.51%

stock-summaryFinancial
[
  {
    "link": "quarterly",
    "btn_text": "All Quarterly Results",
    "header": "Quarterly Results Snapshot (Standalone) - Dec'25 - QoQ",
    "rhs": [
      {
        "prefix": "Net Sales ",
        "suffix": "QoQ Growth in quarter ended Dec 2025 is -34.93% vs 12.30% in Sep 2025",
        "dir": -1
      },
      {
        "prefix": "Standalone Net Profit ",
        "suffix": "QoQ Growth in quarter ended Dec 2025 is -51.55% vs 89.41% in Sep 2025",
        "dir": -1
      }
    ],
    "table": {
      "header": [
        "Dec'25",
        "Sep'25",
        "Change(%)"
      ],
      "body": [
        {
          "field": "Net Sales",
          "val1": "11.29",
          "val2": "17.35",
          "chgp": "-34.93%",
          "chgp_class": "negative"
        },
        {
          "field": "Operating Profit (PBDIT) excl Other Income",
          "val1": "0.00",
          "val2": "3.07",
          "chgp": "-100.00%",
          "chgp_class": "negative"
        },
        {
          "field": "Interest",
          "val1": "0.30",
          "val2": "0.95",
          "chgp": "-68.42%",
          "chgp_class": "positive"
        },
        {
          "field": "Exceptional Items",
          "val1": "0.00",
          "val2": "0.00",
          "chgp": "",
          "chgp_class": "neutral"
        },
        {
          "field": "Standalone Net Profit",
          "val1": "0.78",
          "val2": "1.61",
          "chgp": "-51.55%",
          "chgp_class": "negative"
        },
        {
          "field": "Operating Profit Margin (Excl OI)",
          "val1": "0.00%",
          "val2": "17.69%",
          "chgp": "-17.69%",
          "chgp_class": "negative"
        }
      ]
    }
  },
  {
    "link": "half-yearly",
    "btn_text": "All Half Yearly Results",
    "header": "Half Yearly Results Snapshot (Standalone) - Sep'25",
    "rhs": [
      {
        "prefix": "Net Sales ",
        "suffix": " Growth in half year ended Sep 2025 is 37.87% vs 18.95% in Sep 2024",
        "dir": 1
      },
      {
        "prefix": "Standalone Net Profit ",
        "suffix": " Growth in half year ended Sep 2025 is 50.92% vs 858.82% in Sep 2024",
        "dir": -1
      }
    ],
    "table": {
      "header": [
        "Sep'25",
        "Sep'24",
        "Change(%)"
      ],
      "body": [
        {
          "field": "Net Sales",
          "val1": "32.80",
          "val2": "23.79",
          "chgp": "37.87%",
          "chgp_class": "positive"
        },
        {
          "field": "Operating Profit (PBDIT) excl Other Income",
          "val1": "4.82",
          "val2": "1.42",
          "chgp": "239.44%",
          "chgp_class": "positive"
        },
        {
          "field": "Interest",
          "val1": "1.64",
          "val2": "1.48",
          "chgp": "10.81%",
          "chgp_class": "negative"
        },
        {
          "field": "Exceptional Items",
          "val1": "0.00",
          "val2": "0.00",
          "chgp": "",
          "chgp_class": "neutral"
        },
        {
          "field": "Standalone Net Profit",
          "val1": "2.46",
          "val2": "1.63",
          "chgp": "50.92%",
          "chgp_class": "positive"
        },
        {
          "field": "Operating Profit Margin (Excl OI)",
          "val1": "14.70%",
          "val2": "5.97%",
          "chgp": "8.73%",
          "chgp_class": "positive"
        }
      ]
    }
  },
  {
    "link": "nine-monthly",
    "btn_text": "All Nine Monthly Results",
    "header": "Nine Monthly Results Snapshot (Standalone) - Dec'25",
    "rhs": [
      {
        "prefix": "Net Sales ",
        "suffix": "YoY Growth in nine months ended Dec 2025 is 10.97% vs 24.43% in Dec 2024",
        "dir": -1
      },
      {
        "prefix": "Standalone Net Profit ",
        "suffix": "YoY Growth in nine months ended Dec 2025 is 147.79% vs -2,287.10% in Dec 2024",
        "dir": 1
      }
    ],
    "table": {
      "header": [
        "Dec'25",
        "Dec'24",
        "Change(%)"
      ],
      "body": [
        {
          "field": "Net Sales",
          "val1": "44.09",
          "val2": "39.73",
          "chgp": "10.97%",
          "chgp_class": "positive"
        },
        {
          "field": "Operating Profit (PBDIT) excl Other Income",
          "val1": "4.82",
          "val2": "-6.59",
          "chgp": "173.14%",
          "chgp_class": "positive"
        },
        {
          "field": "Interest",
          "val1": "1.94",
          "val2": "2.25",
          "chgp": "-13.78%",
          "chgp_class": "positive"
        },
        {
          "field": "Exceptional Items",
          "val1": "0.00",
          "val2": "0.00",
          "chgp": "",
          "chgp_class": "neutral"
        },
        {
          "field": "Standalone Net Profit",
          "val1": "3.24",
          "val2": "-6.78",
          "chgp": "147.79%",
          "chgp_class": "positive"
        },
        {
          "field": "Operating Profit Margin (Excl OI)",
          "val1": "10.93%",
          "val2": "-16.59%",
          "chgp": "27.52%",
          "chgp_class": "positive"
        }
      ]
    }
  },
  {
    "link": "annual",
    "btn_text": "All Annual Results",
    "header": "Annual Results Snapshot (Standalone) - Mar'25",
    "rhs": [
      {
        "prefix": "Net Sales ",
        "suffix": "YoY Growth in year ended Mar 2025 is 28.52% vs -3.79% in Mar 2024",
        "dir": 1
      },
      {
        "prefix": "Standalone Net Profit ",
        "suffix": "YoY Growth in year ended Mar 2025 is -67.50% vs 300.00% in Mar 2024",
        "dir": -1
      }
    ],
    "table": {
      "header": [
        "Mar'25",
        "Mar'24",
        "Change(%)"
      ],
      "body": [
        {
          "field": "Net Sales",
          "val1": "63.67",
          "val2": "49.54",
          "chgp": "28.52%",
          "chgp_class": "positive"
        },
        {
          "field": "Operating Profit (PBDIT) excl Other Income",
          "val1": "-7.97",
          "val2": "4.53",
          "chgp": "-275.94%",
          "chgp_class": "negative"
        },
        {
          "field": "Interest",
          "val1": "3.20",
          "val2": "3.45",
          "chgp": "-7.25%",
          "chgp_class": "positive"
        },
        {
          "field": "Exceptional Items",
          "val1": "0.00",
          "val2": "-0.63",
          "chgp": "100.00%",
          "chgp_class": "positive"
        },
        {
          "field": "Standalone Net Profit",
          "val1": "0.26",
          "val2": "0.80",
          "chgp": "-67.50%",
          "chgp_class": "negative"
        },
        {
          "field": "Operating Profit Margin (Excl OI)",
          "val1": "-12.52%",
          "val2": "9.14%",
          "chgp": "-21.66%",
          "chgp_class": "negative"
        }
      ]
    }
  }
]

Quarterly Results Snapshot (Standalone) - Dec'25 - QoQstock-summary

Dec'25
Sep'25
Change(%)
Net Sales
11.29
17.35
-34.93%
Operating Profit (PBDIT) excl Other Income
0.00
3.07
-100.00%
Interest
0.30
0.95
-68.42%
Exceptional Items
0.00
0.00
Standalone Net Profit
0.78
1.61
-51.55%
Operating Profit Margin (Excl OI)
0.00%
17.69%
-17.69%
Values in Rs Cr.
Direction Arrows
Net Sales

QoQ Growth in quarter ended Dec 2025 is -34.93% vs 12.30% in Sep 2025

Direction Arrows
Standalone Net Profit

QoQ Growth in quarter ended Dec 2025 is -51.55% vs 89.41% in Sep 2025

Half Yearly Results Snapshot (Standalone) - Sep'25stock-summary

Sep'25
Sep'24
Change(%)
Net Sales
32.80
23.79
37.87%
Operating Profit (PBDIT) excl Other Income
4.82
1.42
239.44%
Interest
1.64
1.48
10.81%
Exceptional Items
0.00
0.00
Standalone Net Profit
2.46
1.63
50.92%
Operating Profit Margin (Excl OI)
14.70%
5.97%
8.73%
Values in Rs Cr.
Direction Arrows
Net Sales

Growth in half year ended Sep 2025 is 37.87% vs 18.95% in Sep 2024

Direction Arrows
Standalone Net Profit

Growth in half year ended Sep 2025 is 50.92% vs 858.82% in Sep 2024

Nine Monthly Results Snapshot (Standalone) - Dec'25stock-summary

Dec'25
Dec'24
Change(%)
Net Sales
44.09
39.73
10.97%
Operating Profit (PBDIT) excl Other Income
4.82
-6.59
173.14%
Interest
1.94
2.25
-13.78%
Exceptional Items
0.00
0.00
Standalone Net Profit
3.24
-6.78
147.79%
Operating Profit Margin (Excl OI)
10.93%
-16.59%
27.52%
Values in Rs Cr.
Direction Arrows
Net Sales

YoY Growth in nine months ended Dec 2025 is 10.97% vs 24.43% in Dec 2024

Direction Arrows
Standalone Net Profit

YoY Growth in nine months ended Dec 2025 is 147.79% vs -2,287.10% in Dec 2024

Annual Results Snapshot (Standalone) - Mar'25stock-summary

Mar'25
Mar'24
Change(%)
Net Sales
63.67
49.54
28.52%
Operating Profit (PBDIT) excl Other Income
-7.97
4.53
-275.94%
Interest
3.20
3.45
-7.25%
Exceptional Items
0.00
-0.63
100.00%
Standalone Net Profit
0.26
0.80
-67.50%
Operating Profit Margin (Excl OI)
-12.52%
9.14%
-21.66%
Values in Rs Cr.
Direction Arrows
Net Sales

YoY Growth in year ended Mar 2025 is 28.52% vs -3.79% in Mar 2024

Direction Arrows
Standalone Net Profit

YoY Growth in year ended Mar 2025 is -67.50% vs 300.00% in Mar 2024

stock-summaryCompany CV
About Aplab Ltd stock-summary
stock-summary
Aplab Ltd
Micro Cap
Other Electrical Equipment
Founded in 1962 by Mr. P.S. Deodhar, Aplab Limited was originally incorporated as 'Applied Electronics Limited' on September 30, 1964. The Company changed its name to Aplab Limited on October 6, 1994. Company is engaged in the field of industrial power electronics, with its operations centered around the design, control, and conversion of electrical power to meet various industrial requirements.
Company Coordinates stock-summary
Company Details
Aplab House, A-5 Wagle Industrial Estate Thane Maharashtra : 400604
stock-summary
Tel: 022-67395555/67395588
stock-summary
response@aplab.com
Registrar Details
Adroit Corporate Services Pvt Ltd, 17-20 Jaferbhoy Industrial Estate , 1st Floor, Makwana Road, Marol Naka, Mumbai