
Compare Bhandari Hosiery with Similar Stocks
Dashboard
Weak Long Term Fundamental Strength with an average Return on Capital Employed (ROCE) of 8.75%
- Poor long term growth as Net Sales has grown by an annual rate of 4.42% and Operating profit at 10.47% over the last 5 years
- Low ability to service debt as the company has a high Debt to EBITDA ratio of 3.62 times
Flat results in Mar 26
Underperformed the market in the last 1 year
Stock DNA
Garments & Apparels
INR 134 Cr (Micro Cap)
17.00
24
0.36%
0.65
4.97%
0.85
Total Returns (Price + Dividend) 
Latest dividend: 0.02 per share ex-dividend date: Aug-21-2025
Risk Adjusted Returns v/s
Returns Beta

News

Bhandari Hosiery Exports Ltd is Rated Strong Sell
Bhandari Hosiery Exports Ltd is rated Strong Sell by MarketsMOJO. This rating was last updated on 04 June 2026. However, all fundamentals, returns, and financial metrics discussed here reflect the stock’s current position as of 15 June 2026, providing investors with the most up-to-date analysis.
Read full news article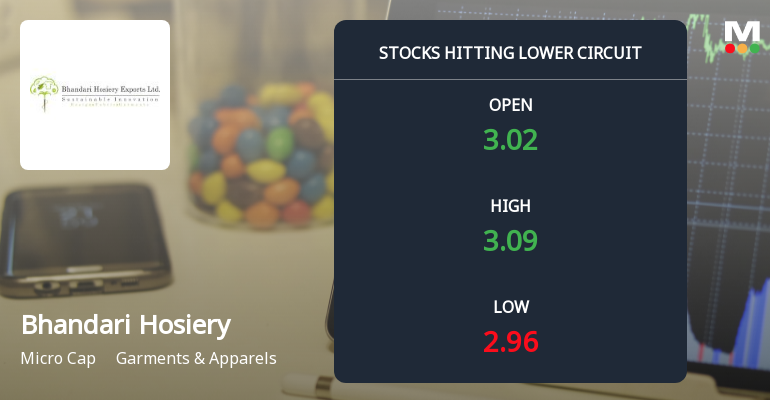
Bhandari Hosiery Exports Ltd Locks at Lower Circuit With 5% Loss — Sellers Queue, No Buyers in Sight
At Rs 2.87, sellers were still queuing — but there were no buyers willing to take the other side. Bhandari Hosiery Exports Ltd locked at its lower circuit of 5% on 11 Jun 2026, with unfilled sell orders and a frozen price, underscoring the persistent selling pressure in this micro-cap stock.
Read full news article
Bhandari Hosiery Exports Ltd Locks at Lower Circuit With 3.47% Loss — Sellers Queue, No Buyers in Sight
At Rs 3.06, sellers were still queuing — but there were no buyers willing to take the other side. Bhandari Hosiery Exports Ltd locked at its lower circuit of 3.47% on 3 Jun 2026, with unfilled sell orders and a frozen price that capped losses within the 5% price band.
Read full news article Announcements
Announcement under Regulation 30 (LODR)-Newspaper Publication
30-May-2026 | Source : BSEPlease find attached copies of newspaper publication for the Financial Results for the quarter and year ended 31.03.2026.
Corporate Action-Board approves Dividend
29-May-2026 | Source : BSEBoard of directors at their meeting held on 29.05.2026 recommended the final dividend of Rs. 0.01 (i.e. 1%) having FV of Rs. 1.
OUTCOME OF BOARD MEETING
29-May-2026 | Source : BSEOUTCOME OF THE BOARD MEETING HELD ON 29.05.2026
Corporate Actions

No Upcoming Board Meetings

Bhandari Hosiery Exports Ltd has declared 2% dividend, ex-date: 21 Aug 25

Bhandari Hosiery Exports Ltd has announced 1:10 stock split, ex-date: 25 Feb 16

Bhandari Hosiery Exports Ltd has announced 7:20 bonus issue, ex-date: 24 Feb 11

Bhandari Hosiery Exports Ltd has announced 4:5 rights issue, ex-date: 25 Feb 26
Quality key factors
Valuation key factors
Technicals key factors
 Technical Indicator Scale: Bearish, Mildly Bearish, Sideways, Mildly Bullish, Bullish Turned
 Shareholding Snapshot : Mar 2026
Shareholding Compare (%holding)
Non Institution
None
Held by 0 Schemes
Held by 0 FIIs
Tikani Exports Limited (17.15%)
Udyan Ashok Singhania (1.95%)
54.43%
Quarterly Results Snapshot (Standalone) - Mar'26 - QoQ

QoQ Growth in quarter ended Mar 2026 is 52.50% vs -13.58% in Dec 2025

QoQ Growth in quarter ended Mar 2026 is -13.70% vs 5.80% in Dec 2025
Half Yearly Results Snapshot (Standalone) - Sep'25
Growth in half year ended Sep 2025 is 3.89% vs 7.39% in Sep 2024
Growth in half year ended Sep 2025 is 19.03% vs -0.64% in Sep 2024
Nine Monthly Results Snapshot (Standalone) - Dec'25
YoY Growth in nine months ended Dec 2025 is 0.51% vs 6.42% in Dec 2024
YoY Growth in nine months ended Dec 2025 is 14.84% vs 4.70% in Dec 2024
Annual Results Snapshot (Standalone) - Mar'26
YoY Growth in year ended Mar 2026 is 0.64% vs 4.43% in Mar 2025
YoY Growth in year ended Mar 2026 is 0.78% vs 18.07% in Mar 2025
About Bhandari Hosiery Exports Ltd

Company Coordinates


