
Compare Nucleus Soft. with Similar Stocks
Dashboard
Poor long term growth as Operating profit has grown by an annual rate -1.13% of over the last 5 years
The company has declared Negative results for the last 3 consecutive quarters
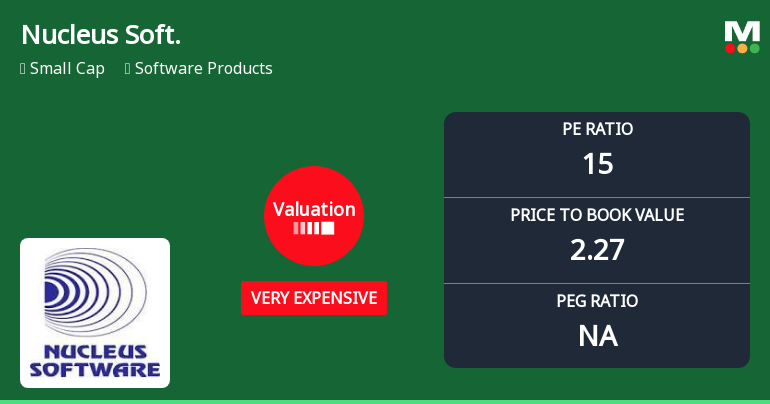
With ROE of 14.9, it has a Very Expensive valuation with a 2.3 Price to Book Value
Falling Participation by Institutional Investors
Below par performance in long term as well as near term
Stock DNA
Software Products
INR 2,001 Cr (Small Cap)
15.00
20
1.62%
-0.45
14.89%
2.27
Total Returns (Price + Dividend) 
Latest dividend: 12.5 per share ex-dividend date: Jul-11-2025
Risk Adjusted Returns v/s
Returns Beta

News
Nucleus Software Exports Ltd Valuation Shifts Signal Elevated Price Risk
Nucleus Software Exports Ltd has seen a marked shift in its valuation parameters, moving from an expensive to a very expensive rating, reflecting increased price pressure despite solid operational metrics. This change, coupled with a downgrade in its Mojo Grade to Sell, highlights growing investor caution amid a challenging market backdrop for the software products sector.
Read full news article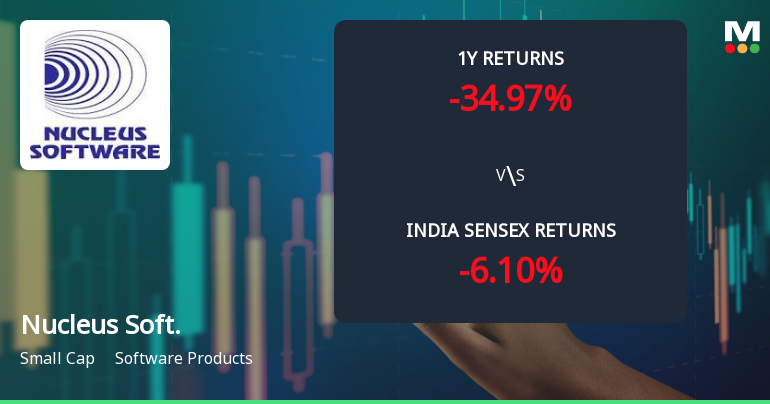
Nucleus Software Exports Ltd: Technical Momentum Shifts Amid Mixed Market Signals
Nucleus Software Exports Ltd has experienced a notable shift in price momentum, reflected in a complex interplay of technical indicators that suggest a cautious outlook. Despite a strong intraday gain of 4.04%, the company’s technical parameters reveal a blend of mildly bullish and bearish signals, prompting a downgrade in its Mojo Grade from Hold to Sell as of 10 Nov 2025.
Read full news article
Nucleus Software Exports Ltd is Rated Sell
Nucleus Software Exports Ltd is rated 'Sell' by MarketsMOJO, with this rating last updated on 10 Nov 2025. However, the analysis and financial metrics discussed here reflect the stock's current position as of 14 June 2026, providing investors with an up-to-date view of the company’s fundamentals, valuation, financial trends, and technical outlook.
Read full news article Announcements
Announcement under Regulation 30 (LODR)-Change in Management
22-Jun-2026 | Source : BSEIntimation for Appointment of Senior Management Personnel i.e. Mr. Bhavit Vijay Godiwala as a Chief Customer Success Officer of the Company w.e.f. June 22 2026
Closure of Trading Window
22-Jun-2026 | Source : BSEPlease find enclosed herewith the Intimation for clsoure of Trading Window
Announcement under Regulation 30 (LODR)-Press Release / Media Release
12-Jun-2026 | Source : BSEPlease find enclosed herewith the Press Release
Corporate Actions

No Upcoming Board Meetings

Nucleus Software Exports Ltd has declared 125% dividend, ex-date: 11 Jul 25

No Splits history available

Nucleus Software Exports Ltd has announced 1:1 bonus issue, ex-date: 03 Aug 07

No Rights history available
Quality key factors
Valuation key factors
Technicals key factors
 Technical Indicator Scale: Bearish, Mildly Bearish, Sideways, Mildly Bullish, Bullish Turned
 Shareholding Snapshot : Mar 2026
Shareholding Compare (%holding)
Promoters
None
Held by 2 Schemes (1.07%)
Held by 66 FIIs (4.47%)
Karmayogi Holdings Private Limited (33.59%)
Barca Global Master Fund, Lp (1.82%)
17.56%
Quarterly Results Snapshot (Consolidated) - Mar'26 - QoQ

QoQ Growth in quarter ended Mar 2026 is 2.15% vs 3.05% in Dec 2025

QoQ Growth in quarter ended Mar 2026 is 66.91% vs -21.26% in Dec 2025
Half Yearly Results Snapshot (Consolidated) - Sep'25
Growth in half year ended Sep 2025 is 8.46% vs -3.51% in Sep 2024
Growth in half year ended Sep 2025 is -2.80% vs -35.55% in Sep 2024
Nine Monthly Results Snapshot (Consolidated) - Dec'25
YoY Growth in nine months ended Dec 2025 is 7.95% vs -2.09% in Dec 2024
YoY Growth in nine months ended Dec 2025 is -16.33% vs -29.56% in Dec 2024
Annual Results Snapshot (Consolidated) - Mar'26
YoY Growth in year ended Mar 2026 is 5.26% vs 0.70% in Mar 2025
YoY Growth in year ended Mar 2026 is -28.38% vs -14.93% in Mar 2025
About Nucleus Software Exports Ltd

Company Coordinates


