
Compare Berger Paints with Similar Stocks
Dashboard
High Management Efficiency with a high ROE of 19.62%
Company has a Debt to Equity ratio (avg) of 0.08 times
Poor long term growth as Operating profit has grown by an annual rate 8.31% of over the last 5 years
Flat results in Mar 26
With ROE of 16.9, it has a Expensive valuation with a 9.3 Price to Book Value
Majority shareholders : Promoters
With its market cap of Rs 64,037 cr, it is the second biggest company in the sector (behind Asian Paints)and constitutes 17.73% of the entire sector
Total Returns (Price + Dividend) 
Latest dividend: 3.8033216783216783 per share ex-dividend date: Aug-05-2025
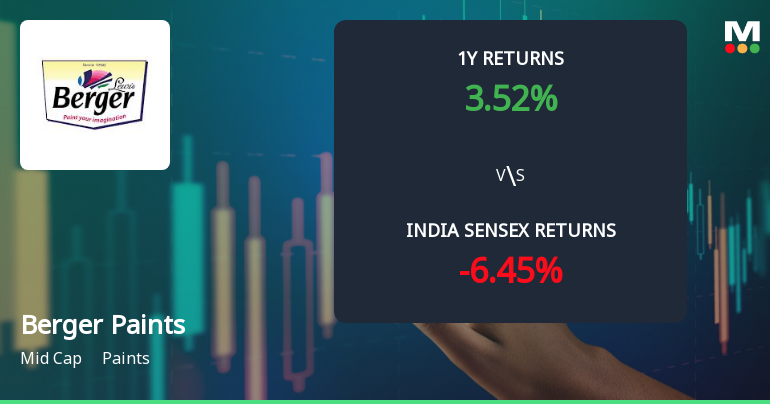
Risk Adjusted Returns v/s
Returns Beta

News
Berger Paints India Ltd Technical Momentum Shifts Amid Mixed Indicator Signals
Berger Paints India Ltd has experienced a notable shift in its technical momentum, transitioning from a mildly bullish trend to a sideways movement. This change is underscored by a complex interplay of technical indicators, including MACD, RSI, moving averages, and Bollinger Bands, which collectively paint a nuanced picture of the stock’s near-term outlook amid a volatile market backdrop.
Read full news article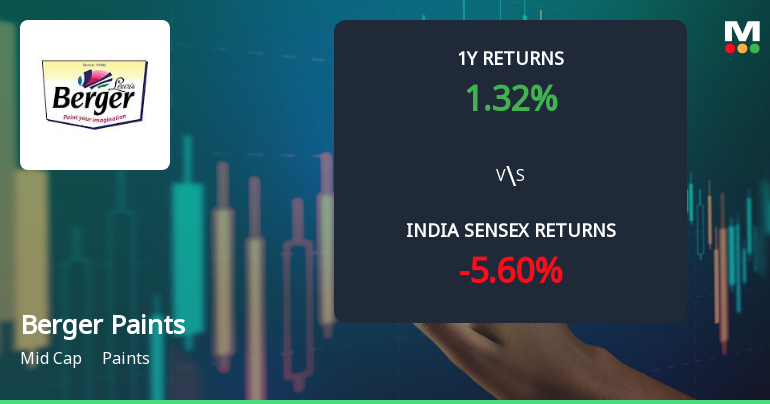
Berger Paints India Ltd Sees Technical Momentum Shift Amid Mixed Indicator Signals
Berger Paints India Ltd has witnessed a significant shift in price momentum, with its shares surging 9.27% to close at ₹551.60 on 22 Jun 2026. This move comes amid a transition from a sideways to a mildly bullish technical trend, reflecting a nuanced interplay of technical indicators that suggest cautious optimism for investors in the mid-cap paints sector player.
Read full news article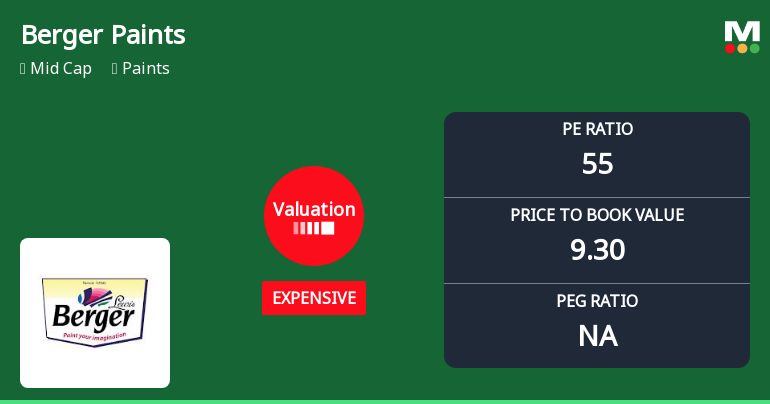
Berger Paints India Ltd: Valuation Shift Signals Price Attractiveness Change Amid Market Rally
Berger Paints India Ltd has witnessed a notable shift in its valuation parameters, moving from a fair to an expensive rating, reflecting evolving investor sentiment amid robust price gains and strong operational metrics. This article analyses the recent changes in key valuation multiples, compares them with historical and peer averages, and assesses the implications for investors navigating the paints sector.
Read full news article Announcements
Deduction Of Tax At Source On Dividend - Shareholders Communication
09-Jun-2026 | Source : BSEPlease find attached letter dated 9th June 2026.
Announcement under Regulation 30 (LODR)-Analyst / Investor Meet - Intimation
01-Jun-2026 | Source : BSEPlease find attached letter dated 01.06.2026 .
Announcement under Regulation 30 (LODR)-Newspaper Publication
20-May-2026 | Source : BSEPlease find attached letter dated 20th May 2026.
Corporate Actions

No Upcoming Board Meetings

Berger Paints India Ltd has declared 380% dividend, ex-date: 05 Aug 25

Berger Paints India Ltd has announced 1:2 stock split, ex-date: 08 Jan 15

Berger Paints India Ltd has announced 1:5 bonus issue, ex-date: 22 Sep 23

No Rights history available
Quality key factors
Valuation key factors
Technicals key factors
 Technical Indicator Scale: Bearish, Mildly Bearish, Sideways, Mildly Bullish, Bullish Turned
 Shareholding Snapshot : Mar 2026
Shareholding Compare (%holding)
Promoters
None
Held by 25 Schemes (6.8%)
Held by 156 FIIs (4.68%)
U K Paints (india) Private Limited (64.56%)
Sbi Large & Midcap Fund (4.33%)
6.09%
Quarterly Results Snapshot (Consolidated) - Mar'26 - QoQ

QoQ Growth in quarter ended Mar 2026 is -3.89% vs 5.53% in Dec 2025
QoQ Growth in quarter ended Mar 2026 is 23.46% vs 31.45% in Dec 2025
Half Yearly Results Snapshot (Consolidated) - Sep'25

Growth in half year ended Sep 2025 is 2.77% vs 1.19% in Sep 2024
Growth in half year ended Sep 2025 is -16.41% vs -3.52% in Sep 2024
Nine Monthly Results Snapshot (Consolidated) - Dec'25
YoY Growth in nine months ended Dec 2025 is 1.94% vs 1.87% in Dec 2024
YoY Growth in nine months ended Dec 2025 is -13.75% vs -2.89% in Dec 2024
Annual Results Snapshot (Consolidated) - Mar'26
YoY Growth in year ended Mar 2026 is 2.91% vs 3.09% in Mar 2025
YoY Growth in year ended Mar 2026 is -4.53% vs 1.08% in Mar 2025
About Berger Paints India Ltd

Company Coordinates


