
Compare Sylph Industries with Similar Stocks
Dashboard
Weak Long Term Fundamental Strength with an average Return on Equity (ROE) of 2.61%
- Company's ability to service its debt is weak with a poor EBIT to Interest (avg) ratio of 0.33
Falling Participation by Institutional Investors
Consistent Underperformance against the benchmark over the last 3 years
Stock DNA
Computers - Software & Consulting
INR 33 Cr (Micro Cap)
4.00
20
0.00%
0.01
5.94%
0.27
Total Returns (Price + Dividend) 
Sylph Industries for the last several years.
Risk Adjusted Returns v/s
Returns Beta

News
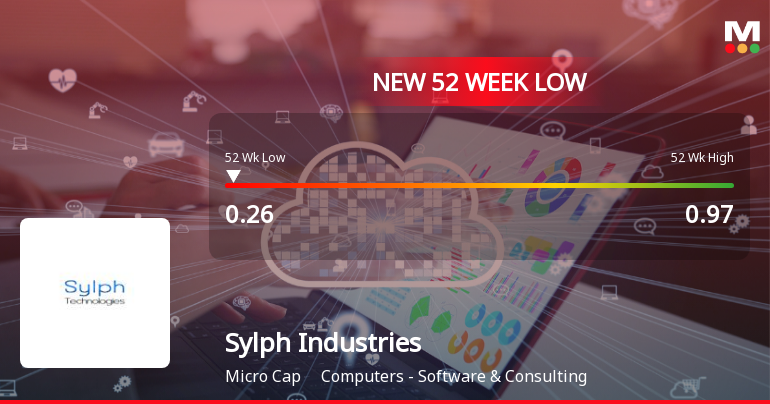
Sylph Industries Ltd Falls to 52-Week Low of Rs 0.26 as Sell-Off Deepens
A sharp decline has pushed Sylph Industries Ltd to a fresh 52-week low of Rs 0.26 on 24 Jun 2026, marking a steep 68.74% drop over the past year despite some encouraging financial results. This disconnect between the share price and the company’s improving earnings raises questions about the underlying market sentiment and valuation concerns.
Read full news article
Sylph Industries Ltd is Rated Sell
Sylph Industries Ltd is rated Sell by MarketsMOJO, with this rating last updated on 20 April 2026. However, the analysis and financial metrics presented here reflect the stock’s current position as of 19 June 2026, providing investors with the latest insights into the company’s fundamentals, valuation, financial trends, and technical outlook.
Read full news article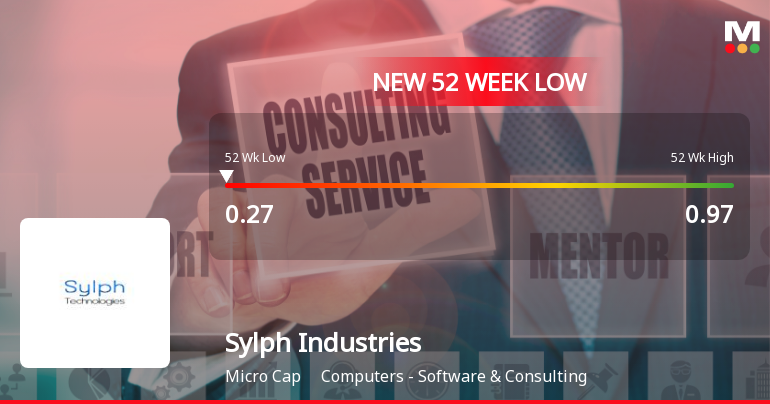
Sylph Industries Ltd Falls to 52-Week Low of Rs 0.27 as Sell-Off Deepens
For the fourth consecutive session, Sylph Industries Ltd has closed lower, culminating in a fresh 52-week low of Rs 0.27 on 16 Jun 2026. This marks a steep decline of 12.9% over the past four days, underscoring persistent selling pressure despite pockets of strength in the broader market.
Read full news article Announcements
Announcement under Regulation 30 (LODR)-Newspaper Publication
04-Jun-2026 | Source : BSENewspaper publication in respect of Audited Standalone and Consolidated Financial Results for the Quarter/ Year Ended 31st March 2026.
Board Meeting Outcome for Outcome Of The Meeting Of The Board Of Directors Of Sylph Industries Limited Held On Today I.E. Tuesday 02Nd June 2026.
02-Jun-2026 | Source : BSEConduct Postal Ballot by means of E-voting for obtaining approval of the members of the Company for approving the Appointment of Mr. Hasmukh Nanalal Shah (DIN: 00398666) as Executive- Managing Director of the Company.
Shareholder Meeting / Postal Ballot-Notice of Postal Ballot
02-Jun-2026 | Source : BSENotice of Postal Ballot
Corporate Actions

No Upcoming Board Meetings

No Dividend history available

Sylph Industries Ltd has announced 1:10 stock split, ex-date: 02 Jun 23

Sylph Industries Ltd has announced 5:11 bonus issue, ex-date: 17 Dec 25

Sylph Industries Ltd has announced 15:11 rights issue, ex-date: 17 Apr 25
Quality key factors
Valuation key factors
Technicals key factors
 Technical Indicator Scale: Bearish, Mildly Bearish, Sideways, Mildly Bullish, Bullish Turned
 Shareholding Snapshot : Dec 2025
Shareholding Compare (%holding)
Non Institution
None
Held by 0 Schemes
Held by 3 FIIs (2.73%)
Mona Amarlal Kukreja (0.0%)
Kredence Multi Trading Limited (2.61%)
57.44%
Quarterly Results Snapshot (Standalone) - Mar'26 - QoQ

QoQ Growth in quarter ended Mar 2026 is 105.20% vs -71.23% in Dec 2025
QoQ Growth in quarter ended Mar 2026 is 2,362.50% vs -92.38% in Dec 2025
Half Yearly Results Snapshot (Consolidated) - Sep'25
Not Applicable: The company has declared_date for only one period
Not Applicable: The company has declared_date for only one period
Nine Monthly Results Snapshot (Standalone) - Dec'25
YoY Growth in nine months ended Dec 2025 is 8,143.69% vs -90.19% in Dec 2024
YoY Growth in nine months ended Dec 2025 is 371.54% vs -78.26% in Dec 2024
Annual Results Snapshot (Consolidated) - Mar'26
Not Applicable: The company has declared_date for only one period
Not Applicable: The company has declared_date for only one period
About Sylph Industries Ltd

Company Coordinates


