
Compare Dhanalaxmi Roto with Similar Stocks
Stock DNA
Garments & Apparels
INR 58 Cr (Micro Cap)
8.00
25
2.05%
-0.68
10.98%
0.91
Total Returns (Price + Dividend) 
Latest dividend: 1.5 per share ex-dividend date: Sep-12-2025
Risk Adjusted Returns v/s
Returns Beta

News
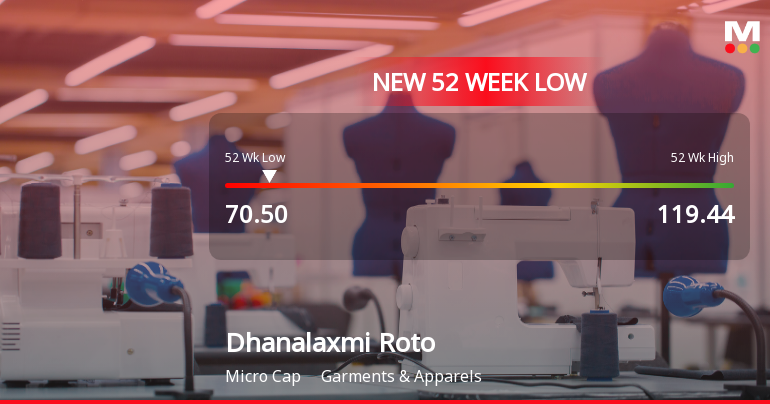
Dhanalaxmi Roto Spinners Ltd Falls to 52-Week Low of Rs 70.5 as Sell-Off Deepens
A sharp decline in the share price has dragged Dhanalaxmi Roto Spinners Ltd to a fresh 52-week low of Rs 70.5 on 29 Jul 2026, marking a significant 41% drop from its 52-week high of Rs 119.44. This downturn comes amid a backdrop of underwhelming financial performance and persistent market headwinds.
Read full news article
Dhanalaxmi Roto Spinners Ltd is Rated Strong Sell
Dhanalaxmi Roto Spinners Ltd is rated Strong Sell by MarketsMOJO, with this rating last updated on 02 June 2026. However, the analysis and financial metrics discussed here reflect the stock's current position as of 21 July 2026, providing investors with the latest insights into its performance and outlook.
Read full news article
Dhanalaxmi Roto Spinners Ltd is Rated Strong Sell
Dhanalaxmi Roto Spinners Ltd is rated Strong Sell by MarketsMOJO. This rating was last updated on 02 June 2026, reflecting a shift from the previous 'Sell' grade. However, all fundamentals, returns, and financial metrics discussed here are current as of 10 July 2026, providing investors with the latest comprehensive view of the stock's position.
Read full news article Announcements
Compliances-Certificate under Reg. 74 (5) of SEBI (DP) Regulations 2018
14-Jul-2026 | Source : BSECertificate under Regulation 74(5) of SEBI (DP) Regulatiuons2018 for the quarter ended on 30th June 2026
Disclosure Under 7(2) Of SEBI (PIT) Regulations 2015
04-Jul-2026 | Source : BSEDisclosure under 7(2) of SEBI (PIT) Regulations 2015
Disclosures under Reg. 29(1) of SEBI (SAST) Regulations 2011
03-Jul-2026 | Source : BSEThe Exchange has received the disclosure under Regulation 29(1) of SEBI (Substantial Acquisition of Shares & Takeovers) Regulations 2011 for Keshav Inani
Corporate Actions

No Upcoming Board Meetings

Dhanalaxmi Roto Spinners Ltd has declared 15% dividend, ex-date: 12 Sep 25

No Splits history available

Dhanalaxmi Roto Spinners Ltd has announced 1:1 bonus issue, ex-date: 26 Mar 25

No Rights history available
Quality key factors
Valuation key factors
Technicals key factors
 Technical Indicator Scale: Bearish, Mildly Bearish, Sideways, Mildly Bullish, Bullish Turned
 Shareholding Snapshot : Jun 2026
Shareholding Compare (%holding)
Non Institution
None
Held by 0 Schemes
Held by 0 FIIs
Keshav Inani (5.68%)
Dhanalaxmi Roto Spinners Limited - Demat Escrow Account For Bonus0 (5%)
23.69%
Quarterly Results Snapshot (Standalone) - Mar'26 - QoQ

QoQ Growth in quarter ended Mar 2026 is 33.09% vs -18.19% in Dec 2025

QoQ Growth in quarter ended Mar 2026 is -63.19% vs -25.23% in Dec 2025
Half Yearly Results Snapshot (Standalone) - Sep'25
Growth in half year ended Sep 2025 is 96.27% vs -17.51% in Sep 2024
Growth in half year ended Sep 2025 is 96.61% vs -59.66% in Sep 2024
Nine Monthly Results Snapshot (Standalone) - Dec'25
YoY Growth in nine months ended Dec 2025 is 40.73% vs 2.43% in Dec 2024
YoY Growth in nine months ended Dec 2025 is 29.28% vs -49.05% in Dec 2024
Annual Results Snapshot (Standalone) - Mar'26
YoY Growth in year ended Mar 2026 is 48.85% vs -5.66% in Mar 2025
YoY Growth in year ended Mar 2026 is -19.56% vs -34.66% in Mar 2025
About Dhanalaxmi Roto Spinners Ltd

Company Coordinates


