
Compare National Standar with Similar Stocks
Dashboard
Poor Management Efficiency with a low ROE of 6.15%
- The company has been able to generate a Return on Equity (avg) of 6.15% signifying low profitability per unit of shareholders funds
Poor long term growth as Operating profit has grown by an annual rate -233.98% of over the last 5 years
Negative results in Mar 26
Risky - Negative EBITDA
Despite the size of the company, domestic mutual funds hold only 0% of the company
Consistent Underperformance against the benchmark over the last 3 years
Total Returns (Price + Dividend) 
National Standar for the last several years.
Risk Adjusted Returns v/s
Returns Beta

News
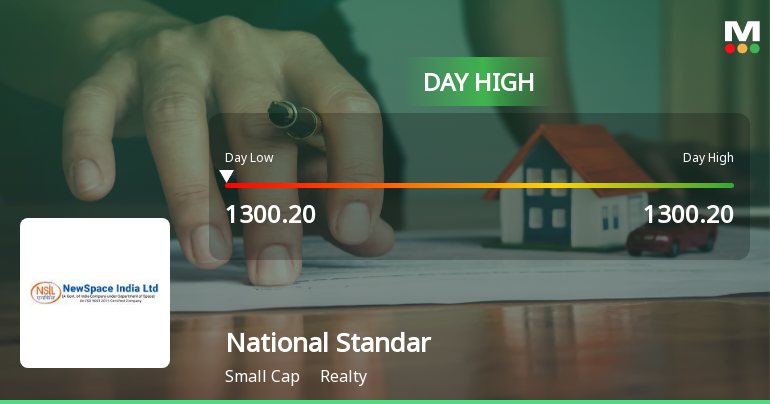
National Standard (India) Ltd Surges 8.35% to Day's High of Rs 1300.2 — Outperforms Realty Sector by 8.56 Percentage Points
The Sensex declined 0.21% on 30 Jun 2026 while National Standard (India) Ltd surged 8.35%, outperforming its Realty sector peers by 8.56 percentage points. This sharp single-session gain stands out as a clear stock-specific event amid a broadly weak market environment.
Read full news article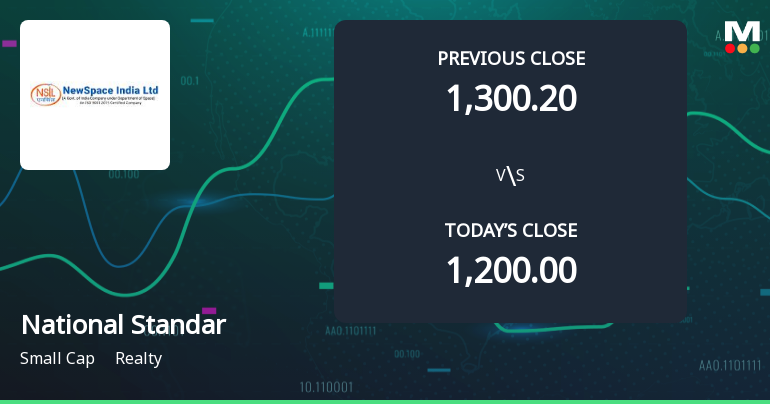
National Standard (India) Ltd Opens 8.35% Higher in Sharp Gap Up, But Can the Technicals Support It?

National Standard (India) Ltd is Rated Strong Sell
National Standard (India) Ltd is rated Strong Sell by MarketsMOJO. This rating was last updated on 17 April 2026. However, all fundamentals, returns, and financial metrics discussed here reflect the company’s current position as of 22 June 2026, providing investors with the latest insights into the stock’s performance and outlook.
Read full news article Announcements
Closure of Trading Window
25-Jun-2026 | Source : BSEClosure of Trading Window
Compliances-Reg.24(A)-Annual Secretarial Compliance
19-May-2026 | Source : BSEAnnual Secretarial Compliance Report for the year ended March 31 2026
Announcement under Regulation 30 (LODR)-Newspaper Publication
18-Apr-2026 | Source : BSENewspaper Advertisement - Audited Financial Results for the quarter and financial year March 31 2026
Corporate Actions

No Upcoming Board Meetings

No Dividend history available

No Splits history available

No Bonus history available

No Rights history available
Quality key factors
Valuation key factors
Technicals key factors
 Technical Indicator Scale: Bearish, Mildly Bearish, Sideways, Mildly Bullish, Bullish Turned
 Shareholding Snapshot : Mar 2026
Shareholding Compare (%holding)
Promoters
None
Held by 0 Schemes
Held by 0 FIIs
Lodha Developers Limited (73.94%)
Gurpreet Kaur Shinh (6.8%)
21.11%
Quarterly Results Snapshot (Standalone) - Mar'26 - QoQ

QoQ Growth in quarter ended Mar 2026 is -100.00% vs -81.62% in Dec 2025
QoQ Growth in quarter ended Mar 2026 is -64.31% vs -23.71% in Dec 2025
Half Yearly Results Snapshot (Standalone) - Sep'25

Growth in half year ended Sep 2025 is 350.39% vs 294.85% in Sep 2024
Growth in half year ended Sep 2025 is -29.66% vs 33.04% in Sep 2024
Nine Monthly Results Snapshot (Standalone) - Dec'25
YoY Growth in nine months ended Dec 2025 is 4.61% vs 23.62% in Dec 2024
YoY Growth in nine months ended Dec 2025 is -11.56% vs -8.75% in Dec 2024
Annual Results Snapshot (Standalone) - Mar'26
YoY Growth in year ended Mar 2026 is -8.55% vs 4.49% in Mar 2025
YoY Growth in year ended Mar 2026 is -26.82% vs -10.45% in Mar 2025
About National Standard (India) Ltd

Company Coordinates


