
Compare Karma Energy Ltd with Similar Stocks
Dashboard
With a Operating Losses, the company has a Weak Long Term Fundamental Strength
- Company's ability to service its debt is weak with a poor EBIT to Interest (avg) ratio of -1.71
- The company has been able to generate a Return on Equity (avg) of 2.39% signifying low profitability per unit of shareholders funds
Negative results in Mar 26
Risky - Negative EBITDA
Below par performance in long term as well as near term
Total Returns (Price + Dividend) 
Latest dividend: 0.5 per share ex-dividend date: Sep-04-2014
Risk Adjusted Returns v/s
Returns Beta

News

Karma Energy Ltd is Rated Strong Sell
Karma Energy Ltd is rated Strong Sell by MarketsMOJO, with this rating last updated on 01 August 2025. However, the analysis and financial metrics discussed here reflect the company’s current position as of 15 July 2026, providing investors with an up-to-date view of its performance and outlook.
Read full news article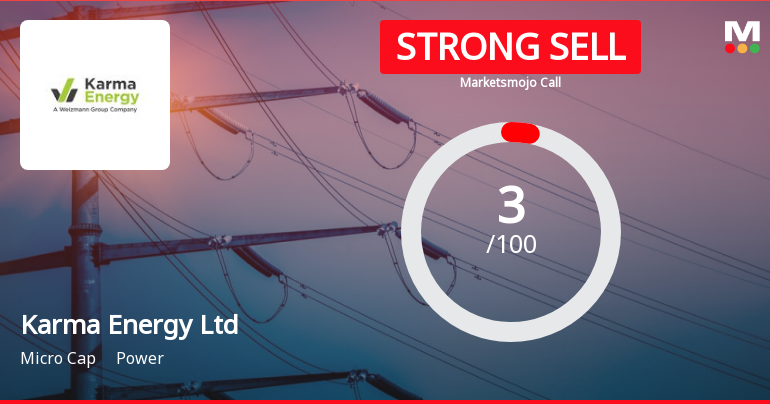
Karma Energy Ltd is Rated Strong Sell
Karma Energy Ltd is rated Strong Sell by MarketsMOJO, with this rating last updated on 01 Aug 2025. However, the analysis and financial metrics discussed here reflect the company’s current position as of 30 June 2026, providing investors with an up-to-date view of the stock’s fundamentals, valuation, financial trend, and technical outlook.
Read full news article
Karma Energy Ltd is Rated Strong Sell
Karma Energy Ltd is rated Strong Sell by MarketsMOJO, with this rating last updated on 01 August 2025. However, the analysis and financial metrics presented here reflect the company’s current position as of 18 June 2026, providing investors with an up-to-date view of its fundamentals, valuation, financial trends, and technical outlook.
Read full news article Announcements
Compliances-Certificate under Reg. 74 (5) of SEBI (DP) Regulations 2018
08-Jul-2026 | Source : BSECertificate under Regulation 74(5) of SEBI (DP) Regulations 2018 for the quarter ended 30th June 2026.
Announcement under Regulation 30 (LODR)-Newspaper Publication
02-Jul-2026 | Source : BSENotce of AGM published in Newspapers
Reg. 34 (1) Annual Report.
01-Jul-2026 | Source : BSEIn terms of regulation 34 of the SEBI (Listing Obligations and disclosure requirement Regulations 2015 (SEBI LODR) copy of the 19th Annual Report along with the Notice of the 19th AGM dated July 28 2026 sent to the shareholders of the Company is enclosed herewith
Corporate Actions

No Upcoming Board Meetings

Karma Energy Ltd has declared 5% dividend, ex-date: 04 Sep 14

No Splits history available

No Bonus history available

No Rights history available
Quality key factors
Valuation key factors
Technicals key factors
 Technical Indicator Scale: Bearish, Mildly Bearish, Sideways, Mildly Bullish, Bullish Turned
 Shareholding Snapshot : Mar 2026
Shareholding Compare (%holding)
Promoters
None
Held by 0 Schemes
Held by 0 FIIs
Kotta Enterprises Private Limited (29.94%)
Kanan Neelkamal Siraj (2.08%)
15.96%
Quarterly Results Snapshot (Standalone) - Mar'26 - YoY

YoY Growth in quarter ended Mar 2026 is -6.38% vs -8.74% in Mar 2025

YoY Growth in quarter ended Mar 2026 is -646.67% vs 108.62% in Mar 2025
Half Yearly Results Snapshot (Standalone) - Sep'25
Growth in half year ended Sep 2025 is 12.61% vs -30.55% in Sep 2024
Growth in half year ended Sep 2025 is -37.59% vs -6.99% in Sep 2024
Nine Monthly Results Snapshot (Standalone) - Dec'25
YoY Growth in nine months ended Dec 2025 is 14.43% vs -31.51% in Dec 2024
YoY Growth in nine months ended Dec 2025 is 49.21% vs -32.62% in Dec 2024
Annual Results Snapshot (Standalone) - Mar'26
YoY Growth in year ended Mar 2026 is 12.18% vs -29.55% in Mar 2025
YoY Growth in year ended Mar 2026 is -25.00% vs 1,066.67% in Mar 2025
About Karma Energy Ltd

Company Coordinates


