
Compare Polycon Intl. with Similar Stocks
Dashboard
With HIgh Debt (Debt-Equity Ratio at 30.32 times)- the company has a Weak Long Term Fundamental Strength
- Poor long term growth as Net Sales has grown by an annual rate of -8.58% and Operating profit at 0% over the last 5 years
- The company is Net-Debt Free
The company has declared Negative results for the last 3 consecutive quarters
Risky - Negative Operating Profits
Below par performance in long term as well as near term
Stock DNA
Packaging
INR 12 Cr (Micro Cap)
NA (Loss Making)
36
0.00%
30.32
-260.36%
10.81
Total Returns (Price + Dividend) 
Polycon Intl. for the last several years.
Risk Adjusted Returns v/s
Returns Beta

News
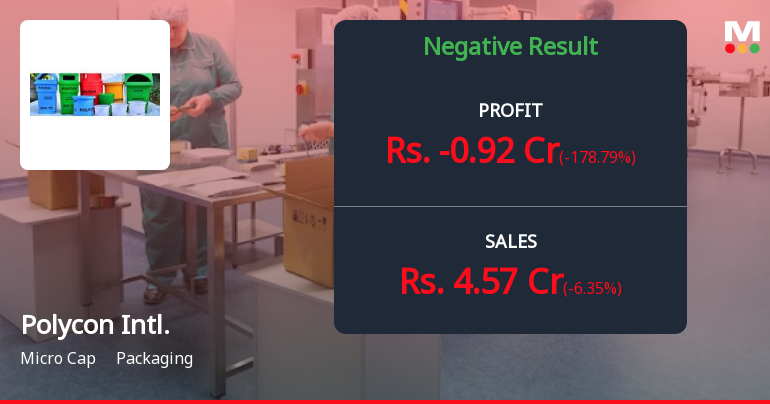
Polycon International Q4 FY26: Mounting Losses and Deteriorating Margins Signal Deep Distress
Polycon International Ltd., a micro-cap packaging company with a market capitalisation of ₹10.00 crores, reported deeply concerning results for the quarter ended March 2026, posting a net loss of ₹0.92 crores compared to a loss of ₹0.33 crores in the year-ago period. The Jaipur-based manufacturer of PET bottles, jars, and rotomoulding water storage tanks continues to struggle with operational inefficiencies, negative margins, and mounting debt burdens that have pushed the stock down 19.55% year-to-date and 28.29% over the past six months.
Read full news article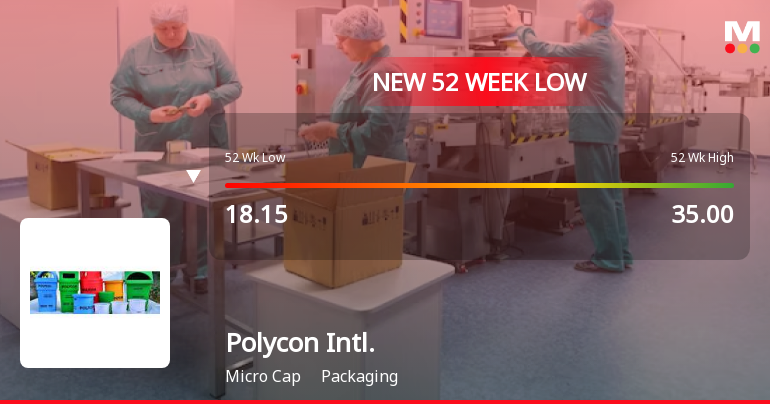
Announcements
Closure of Trading Window
19-Jun-2026 | Source : BSEPolycon International Limited has informed that trading window for designated persons and their relatives will be remains closed from 1st July2026 till the expiry of 48 hours after the declaration of Unaudited Standalone Financial Results of the Company for the Quarter ended 30th June2026.
Board Meeting Outcome for Outcome Of Board Meeting -Audited Financial Results.
29-May-2026 | Source : BSEThe Polycon International Limited has informed that Board has interalia approved the Standalone Financial Results for the Quarter and Year ended on 31-03-2026 in its meeting held on 29-05-2026.
Standalone Audited Financial Results For The Quarter And Year Ended On 31-03-2026
29-May-2026 | Source : BSEPolycon International Limited has submitted Standalone Audited Financial Results for the Quarter and Year ended 31-03-2026 approved by the Board in its meeting held on 29-05-2026.
Corporate Actions

No Upcoming Board Meetings

No Dividend history available

No Splits history available

No Bonus history available

No Rights history available
Quality key factors
Valuation key factors
Technicals key factors
 Technical Indicator Scale: Bearish, Mildly Bearish, Sideways, Mildly Bullish, Bullish Turned
 Shareholding Snapshot : Mar 2026
Shareholding Compare (%holding)
Non Institution
None
Held by 0 Schemes
Held by 0 FIIs
Jai Sinter Polycon Private Limited (11.71%)
Sankalp Granites (p) Ltd (10.66%)
23.55%
Quarterly Results Snapshot (Standalone) - Mar'26 - YoY

YoY Growth in quarter ended Mar 2026 is -6.35% vs -12.39% in Mar 2025

YoY Growth in quarter ended Mar 2026 is -178.79% vs -158.93% in Mar 2025
Half Yearly Results Snapshot (Standalone) - Sep'25
Growth in half year ended Sep 2025 is -30.07% vs 3.07% in Sep 2024
Growth in half year ended Sep 2025 is -284.85% vs 23.26% in Sep 2024
Nine Monthly Results Snapshot (Standalone) - Dec'25
YoY Growth in nine months ended Dec 2025 is -24.00% vs -1.60% in Dec 2024
YoY Growth in nine months ended Dec 2025 is -517.02% vs 194.00% in Dec 2024
Annual Results Snapshot (Standalone) - Mar'26
YoY Growth in year ended Mar 2026 is -20.08% vs -4.17% in Mar 2025
YoY Growth in year ended Mar 2026 is -2,157.14% vs 133.33% in Mar 2025
About Polycon International Ltd

Company Coordinates


