Vikas Ecotech

  • Market Cap: Micro Cap
  • Industry: Specialty Chemicals
  • ISIN: INE806A01020
  • NSEID: VIKASECO
  • BSEID: 530961
INR
1.20
-0.01 (-0.83%)
BSENSE

Mar 25

BSE+NSE Vol: 36.43 lacs

  • Price Points
  • Score
  • Mojo Parameters
  • Total Return
  • News and Corporate Actions
  • Key factors
  • Shareholding
  • Financials
  • CompanyCV
stock-summaryPrice Point
High/Low

1Day

52 Week

Valuation
Technical
Day's Volume

CASH

36.43 lacs (3.13%) Volume

Shareholding (Dec 2025)

FII

0.00%

Held by 2 FIIs

DII

0.00%

Held by 0 DIIs

Promoter

10.65%

Who are the top shareholders of the Vikas Ecotech?

06-Jun-2025

The top shareholders of Vikas Ecotech include promoter Vikas Garg with 10.1%, public shareholder J B Rolling Mills Limited at 4.18%, and individual investors holding 74.14%. Additionally, foreign institutional investors hold 0.02%, with a minimal pledged promoter holding of 0.0364%.

The top shareholders of Vikas Ecotech include Vikas Garg, who is the promoter with the highest holding at 10.1%. The highest public shareholder is J B Rolling Mills Limited, holding 4.18%. Additionally, individual investors collectively hold a significant portion of the company at 74.14%. The company also has some foreign institutional investors, with 2 FIIs holding a total of 0.02%. Notably, there is a very small percentage of pledged promoter holdings at 0.0364%.

View full answer

how big is Vikas Ecotech?

06-Jun-2025

As of Jun 06, Vikas Ecotech Ltd has a market capitalization of 419.18 Cr, with recent net sales of 377.66 Cr and a net profit of 16.98 Cr over the last four quarters. Shareholder's funds are 376.42 Cr, and total assets amount to 443.58 Cr as of Mar'24.

Market Cap: As of Jun 06, Vikas Ecotech Ltd has a market capitalization of 419.18 Cr, categorizing it as a Micro Cap company.<BR><BR>Recent Quarterly Performance: For the latest four quarters, Vikas Ecotech reported a sum of Net Sales amounting to 377.66 Cr and a sum of Net Profit totaling 16.98 Cr. This data is on a Consolidated basis.<BR><BR>Balance Sheet Snapshot: The balance sheet data is also on a Consolidated basis for the latest annual period ending in Mar'24. Shareholder's Funds are reported at 376.42 Cr, while Total Assets stand at 443.58 Cr.

View full answer

What does Vikas Ecotech do?

06-Jun-2025

Vikas Ecotech Ltd is a micro-cap company in the specialty chemicals industry, with net sales of 103 Cr and a net profit of 4 Cr for the quarter ending March 2025. The company has a market cap of Rs 419 Cr and a P/E ratio of 25.00.

Overview: <BR>Vikas Ecotech Ltd operates in the specialty chemicals industry and is classified as a micro-cap company.<BR><BR>History: <BR>The company was originally incorporated on November 30, 1984, as "Vikas Leasing Limited." It underwent several name changes, first to "Vikas Profin Limited" on January 7, 2002, and then to "Vikas Globalone Limited" on December 31, 2008. The most recent quarterly results report net sales and net profit for the period ending March 2025.<BR><BR>Financial Snapshot: <BR>- Net Sales: 103 Cr (Quarterly Results - Mar 2025) <BR>- Net Profit: 4 Cr (Quarterly Results - Mar 2025) <BR>- Market Cap: Rs 419 Cr (Micro Cap) <BR><BR>Key Metrics: <BR>- P/E: 25.00 <BR>- Industry P/E: 47 <BR>- Dividend Yield: 0.00% <BR>- Debt-Equity: 0.06 <BR>- Return on Equity: 4.32% <BR>- Price to Book: 1.07 <BR><BR>Contact Details: <BR>Address: Vikas Apartments, 34/1 East Punjabi Bagh New Delhi New Delhi : 110026 <BR>Tel: 91-011-43144444 <BR>Email: investor@vikasglobal.in <BR>Website: http://www.vikasecotech.com

View full answer

What is the bonus history of the Vikas Ecotech?

06-Jun-2025

Vikas Ecotech issued a bonus in a 3:2 ratio on November 13, 2014, rewarding shareholders with three shares for every two held. The record date for this bonus was November 15, 2014.

Vikas Ecotech has a bonus history that includes a notable issue announced as a 3:2 ratio. This bonus was issued with an ex-date of November 13, 2014, and the record date was set for November 15, 2014. This means that for every two shares held, shareholders received three shares, reflecting the company's approach to rewarding its investors during that time. If you have any more questions about Vikas Ecotech or its financial activities, feel free to ask!

View full answer

Has Vikas Ecotech declared dividend?

06-Jun-2025

Vikas Ecotech Ltd has declared a 5% dividend, amounting to 0.05 per share, with an ex-date of September 19, 2019. However, the dividend yield is 0%, and the company has experienced significant negative total returns over various periods, indicating poor performance.

Vikas Ecotech Ltd has declared a 5% dividend.<BR><BR>Dividend Details:<BR>- Percentage announced: 5%<BR>- Amount per share: 0.05<BR>- Ex-date: 19 Sep 19<BR><BR>Dividend Yield: 0%<BR><BR>Total Returns by Period:<BR>Over the 6 months, the price return was -30.9%, the dividend return was 0%, resulting in a total return of -30.9%.<BR><BR>For the 1 year period, the price return was -36.29%, the dividend return was 0%, leading to a total return of -36.29%.<BR><BR>In the 2 years period, the price return was -19.93%, the dividend return was 0%, culminating in a total return of -19.93%.<BR><BR>Over the 3 years, the price return was -36.12%, the dividend return was 0%, which resulted in a total return of -36.12%.<BR><BR>For the 4 years period, the price return was -4.05%, the dividend return was 0%, leading to a total return of -4.05%.<BR><BR>In the 5 years period, the price return was -49.89%, the dividend return was 0%, resulting in a total return of -49.89%.<BR><BR>Overall, while Vikas Ecotech Ltd declared a dividend, the total returns over various periods indicate significant negative performance, with no dividends contributing to returns in the recent years. The dividend yield remains at 0%, reflecting a lack of ongoing dividend payments following the last declaration.

View full answer

Who are the peers of the Vikas Ecotech?

03-Jun-2025

Vikas Ecotech's peers include Pidilite Industries, SRF, Gujarat Fluoroch, Deepak Nitrite, Himadri Special, Multibase India, Titan Biotech, Diamines & Chem., and Dynemic Products. Among these, SRF has the highest 1-year return at 30.57%, while Vikas Ecotech has the lowest at -36.41%.

Peers: The peers of Vikas Ecotech are Pidilite Inds., SRF, Gujarat Fluoroch, Deepak Nitrite, Himadri Special, Multibase India, Titan Biotech, Diamines & Chem., and Dynemic Products.<BR><BR>Quality Snapshot: Excellent management risk is observed at Pidilite Inds., SRF, Deepak Nitrite, Titan Biotech, and Diamines & Chem., while Good management risk is found at Himadri Special and the rest. Average management risk is present at Gujarat Fluoroch, Multibase India, Dynemic Products, and Vikas Ecotech. For Growth, Excellent growth is noted at Himadri Special, while Average growth is seen at Pidilite Inds., SRF, and the rest. Below Average growth is identified at Gujarat Fluoroch, Deepak Nitrite, Multibase India, Titan Biotech, Diamines & Chem., Dynemic Products, and Vikas Ecotech. In terms of Capital Structure, Excellent capital structure is held by Pidilite Inds., SRF, Deepak Nitrite, Titan Biotech, and Diamines & Chem., while Good capital structure is noted at Himadri Special and Gujarat Fluoroch, and the rest have Below Average or Average capital structures.<BR><BR>Return Snapshot: The peer with the highest 1-year return is SRF at 30.57%, while Vikas Ecotech has the lowest at -36.41%. Vikas Ecotech's return is significantly lower than all peers. Additionally, peers with negative six-month returns include Deepak Nitrite, Vikas Ecotech, Multibase India, Titan Biotech, Diamines & Chem., and Chembond Chem.

View full answer

What is the technical trend for Vikas Ecotech?

09-Jun-2025

As of May 27, 2025, Vikas Ecotech's technical trend is mildly bearish, with mixed signals from key indicators like the MACD, moving averages, and Bollinger Bands.

As of 27 May 2025, the technical trend for Vikas Ecotech has changed from bearish to mildly bearish. The weekly MACD indicates a mildly bullish stance, while the monthly MACD remains bearish. The daily moving averages are mildly bearish, and Bollinger Bands are bearish on both weekly and monthly time frames. The KST shows a mildly bullish signal weekly but bearish monthly, and the OBV is mildly bullish weekly with no trend monthly. Overall, the current stance is mildly bearish, with key indicators like the daily moving averages and Bollinger Bands contributing to this outlook.

View full answer

Who are in the management team of Vikas Ecotech?

16-Jul-2025

As of March 2022, the management team of Vikas Ecotech includes Vikas Garg (Managing Director), Ravi Kumar Gupta (Non-Executive & Independent Director), Kratika Godika (Independent Director), Prashant Sajwani (Company Secretary & Compliance Officer), Dinesh Bhardwaj (Whole-time Director), and Gyan Prakash Govil (Chairman & Independent Director). Each member contributes to the company's governance and operations.

As of March 2022, the management team of Vikas Ecotech includes the following individuals:<BR><BR>1. Vikas Garg - Managing Director<BR>2. Ravi Kumar Gupta - Non-Executive & Independent Director<BR>3. Kratika Godika - Independent Director<BR>4. Prashant Sajwani - Company Secretary & Compliance Officer<BR>5. Dinesh Bhardwaj - Whole-time Director<BR>6. Gyan Prakash Govil - Chairman & Independent Director<BR><BR>Each member plays a significant role in the governance and operational oversight of the company.

View full answer

Is Vikas Ecotech overvalued or undervalued?

08-Aug-2025

As of August 7, 2025, Vikas Ecotech is considered overvalued with a valuation grade of expensive, a PE ratio of 22.71, and a year-to-date decline of 31.45%, underperforming against the Sensex, while its peers have higher valuations.

As of 7 August 2025, the valuation grade for Vikas Ecotech has moved from very expensive to expensive. This indicates a slight improvement in perceived value, yet the company remains on the higher end of the valuation spectrum. Based on the current analysis, Vikas Ecotech is considered overvalued. The company has a PE ratio of 22.71, an EV to EBITDA of 34.25, and a Price to Book Value of 0.98, which are relatively high compared to its peers.<BR><BR>In comparison, Solar Industries and Gujarat Fluoroch are both classified as very expensive, with PE ratios of 111.5 and 64.11, respectively, while Godrej Industries stands out as attractive with a PE of 38.02. The disparity in these ratios suggests that Vikas Ecotech, despite its expensive classification, does not offer a compelling valuation relative to its peers. Furthermore, Vikas Ecotech has underperformed significantly against the Sensex, with a year-to-date decline of 31.45% compared to a 3.18% increase in the index, reinforcing the notion that the stock may not be a favorable investment at its current price.

View full answer

How has been the historical performance of Vikas Ecotech?

14-Nov-2025

Vikas Ecotech's historical performance shows fluctuating net sales and profits, with net sales increasing to 377.67 crore in March 2025 but down from 402.67 crore in March 2023. Despite a decline in operating profit, profit before tax rose significantly to 21.53 crore, leading to a profit after tax of 16.98 crore.

Answer:<BR>The historical performance of Vikas Ecotech shows a fluctuating trend in net sales and profits over the years. <BR><BR>Breakdown:<BR>In the fiscal year ending March 2025, Vikas Ecotech reported net sales of 377.67 crore, an increase from 258.63 crore in March 2024 but a decrease from 402.67 crore in March 2023. The total operating income for March 2025 was also 377.67 crore, reflecting the same trend as net sales. The company's total expenditure, excluding depreciation, rose to 365.72 crore in March 2025 from 242.68 crore in March 2024. Operating profit, excluding other income, decreased to 11.95 crore in March 2025 from 15.95 crore in March 2024, resulting in an operating profit margin of 3.16%. Profit before tax significantly increased to 21.53 crore in March 2025 from 9.42 crore in March 2024, leading to a profit after tax of 16.98 crore, up from 6.85 crore the previous year. The earnings per share for March 2025 was reported at 0.12, compared to 0.05 in March 2024. Overall, while Vikas Ecotech experienced a decline in sales and operating profit, it showed a notable improvement in profit before tax and profit after tax in the latest fiscal year.

View full answer

When is the next results date for Vikas Ecotech Ltd?

01-Feb-2026

The next results date for Vikas Ecotech Ltd is 05 February 2026.

The next results date for Vikas Ecotech Ltd is scheduled for 05 February 2026.

View full answer

Are Vikas Ecotech Ltd latest results good or bad?

06-Feb-2026

Vikas Ecotech Ltd's latest Q3 FY26 results are concerning, showing a net loss of ₹1.66 crores and an 18.92% year-on-year revenue decline, alongside deteriorating operating margins and a low return on equity of 1.98%. This indicates ongoing operational challenges and weakening demand.

Vikas Ecotech Ltd's latest results for Q3 FY26 indicate a challenging financial situation. The company reported a net loss of ₹1.66 crores, marking a significant decline of 194.86% compared to the previous quarter's profit of ₹1.75 crores. This loss represents the second consecutive quarter of negative earnings, highlighting ongoing operational difficulties.<BR><BR>Revenue for the quarter was ₹68.72 crores, which is an 18.92% decrease year-on-year, although it showed a slight improvement of 6.18% compared to the previous quarter. However, this growth is not enough to offset the broader trend of declining sales, which suggests weakening demand or potential market share losses.<BR><BR>Operating margins have also deteriorated, falling to just 2.98%, down from 4.13% in the prior quarter and 5.38% a year earlier. This compression in margins indicates rising costs or operational inefficiencies that the company has struggled to manage.<BR><BR>Additionally, the company's return on equity (ROE) stands at a low 1.98%, further illustrating the challenges it faces in generating adequate returns for shareholders. The overall financial performance reflects a combination of declining revenues, increasing losses, and significant operational challenges, which points to a concerning outlook for Vikas Ecotech Ltd.

View full answer

Should I buy, sell or hold Vikas Ecotech Ltd?

06-Feb-2026

Why is Vikas Ecotech Ltd falling/rising?

17-Mar-2026

As of 17-Mar, Vikas Ecotech Ltd's stock price has risen to 1.27, reflecting a 2.42% increase today. However, it has a year-to-date decline of 24.40% and is trading below its moving averages, indicating ongoing performance challenges.

As of 17-Mar, Vikas Ecotech Ltd's stock price is rising, currently at 1.27, which reflects an increase of 0.03 or 2.42%. This rise is notable as it outperformed the sector by 2.43% today. Additionally, there has been a significant increase in investor participation, with a delivery volume of 32.13 lacs on 16 March, which is up by 69.69% compared to the 5-day average delivery volume. <BR><BR>However, it is important to note that despite today's positive movement, the stock has been underperforming over longer periods, with a year-to-date decline of 24.40% and a one-year decline of 46.41%. Furthermore, the stock is trading below its moving averages across various time frames, indicating a general downward trend. <BR><BR>In summary, while Vikas Ecotech Ltd is experiencing a short-term rise in stock price today, the broader context shows significant historical declines and ongoing challenges in performance relative to benchmarks.

View full answer

Why is Vikas Ecotech Ltd falling/rising?

18-Mar-2026

As of 18-Mar, Vikas Ecotech Ltd's stock price is rising to 1.32, reflecting a 3.94% increase. Despite this short-term gain, the stock has a poor long-term outlook with a -44.30% return over the past year and significant financial challenges.

As of 18-Mar, Vikas Ecotech Ltd's stock price is rising, currently at 1.32, reflecting a change of 0.05 or 3.94% increase. This upward movement can be attributed to the stock outperforming its sector by 3.45% today and experiencing consecutive gains over the last two days, with a total increase of 6.45% during this period. Additionally, the stock's current price is higher than its 5-day moving averages, indicating a short-term positive trend.<BR><BR>However, it is important to note that the stock has faced significant challenges in the longer term. Over the past year, it has generated a return of -44.30%, and its performance has been below par compared to benchmarks like the Sensex, which has seen a positive return of 1.86% in the same period. The company has also reported negative results in recent quarters, with a substantial fall in net sales of -22.71% and a negative profit after tax of Rs -1.66 crore, which reflects a decline of 184.4% compared to previous averages.<BR><BR>Despite the recent rise, the overall long-term outlook remains weak due to a high debt to EBITDA ratio of 3.02 times and a low return on equity of 5.45%, indicating challenges in profitability and financial health. Thus, while the stock is currently rising, it is essential to consider the broader context of its long-term performance and financial fundamentals.

View full answer

Why is Vikas Ecotech Ltd falling/rising?

19-Mar-2026

As of 19-Mar, Vikas Ecotech Ltd's stock price is at Rs 1.26, down 4.55%, significantly underperforming the Sensex. The stock has declined 25.00% year-to-date and is trading below its moving averages, indicating a bearish trend.

As of 19-Mar, Vikas Ecotech Ltd's stock price is falling, currently at Rs 1.26, which reflects a decrease of Rs 0.06 or 4.55%. The stock has underperformed compared to the benchmark Sensex, which has declined by 2.40% over the past week, while Vikas Ecotech has seen a larger drop of 3.08%. Over the past month, the stock has fallen by 16.00%, significantly more than the Sensex's 10.05% decline. Year-to-date, Vikas Ecotech's stock has decreased by 25.00%, compared to a 12.92% drop in the Sensex.<BR><BR>The stock is also trading lower than its moving averages across various time frames, including the 5-day, 20-day, 50-day, 100-day, and 200-day averages, indicating a bearish trend. Additionally, the stock is close to its 52-week low, being only 4.76% away from Rs 1.20. Despite a rise in investor participation, with delivery volume increasing by 13.03% on March 18, the overall performance remains weak, as the stock has fallen after two consecutive days of gains and has underperformed its sector, which has declined by 2.47%. This combination of factors contributes to the current downward movement in Vikas Ecotech Ltd's stock price.

View full answer

Why is Vikas Ecotech Ltd falling/rising?

20-Mar-2026

As of 20-Mar, Vikas Ecotech Ltd's stock price is Rs 1.26, unchanged from the previous session, with a year-to-date decline of 25.00% and a one-year drop of 48.57%. The stock is trading below its moving averages and near its 52-week low, indicating a bearish trend despite increased investor participation.

As of 20-Mar, Vikas Ecotech Ltd's stock price is currently at Rs 1.26, showing no change from the previous trading session. The stock has experienced a significant decline over various periods, with a year-to-date decrease of 25.00% and a one-year drop of 48.57%. This underperformance is starkly contrasted with the Sensex, which has only fallen by 12.54% year-to-date and 2.38% over the past year.<BR><BR>The stock is also trading lower than its moving averages across multiple time frames, including the 5-day, 20-day, 50-day, 100-day, and 200-day averages, indicating a bearish trend. Furthermore, it is close to its 52-week low, being just 4.76% above the low of Rs 1.20. <BR><BR>Despite these negative indicators, there has been a rise in investor participation, with a delivery volume of 28.66 lacs on March 19, which is an increase of 40.78% compared to the 5-day average. This suggests some level of interest from investors, although it has not translated into a price increase.<BR><BR>Overall, the combination of significant declines in stock performance compared to the benchmark, trading below moving averages, and proximity to a 52-week low contributes to the perception that Vikas Ecotech Ltd's stock is falling.

View full answer

Why is Vikas Ecotech Ltd falling/rising?

23-Mar-2026

As of 23-Mar, Vikas Ecotech Ltd's stock price is at Rs. 1.21, reflecting a significant decline with a new 52-week low of Rs. 1.16. The stock has dropped 27.98% year-to-date and 50.21% over the past year, indicating a bearish trend exacerbated by reduced investor participation and sector-wide declines.

As of 23-Mar, Vikas Ecotech Ltd's stock price is falling, currently at Rs. 1.21, which reflects a decrease of Rs. 0.05 or 3.97%. The stock has hit a new 52-week low of Rs. 1.16 today, indicating significant downward pressure. Over the past week, the stock has declined by 2.42%, while its performance over the past month shows a more substantial drop of 17.69%. Year-to-date, the stock has fallen by 27.98%, and over the past year, it has decreased by 50.21%. <BR><BR>In comparison to the benchmark Sensex, which has decreased by 3.72% over the past week and 12.72% over the past month, Vikas Ecotech's declines are more pronounced. The stock is also trading below its 5-day, 20-day, 50-day, 100-day, and 200-day moving averages, suggesting a bearish trend. Additionally, there has been a notable decline in investor participation, with delivery volume dropping by 33.4% against the 5-day average. The chemicals sector, in which Vikas Ecotech operates, has also experienced a decline of 3.81%, further contributing to the negative sentiment surrounding the stock. Overall, these factors indicate a consistent trend of falling prices for Vikas Ecotech Ltd.

View full answer

Why is Vikas Ecotech Ltd falling/rising?

24-Mar-2026

As of 24-Mar, Vikas Ecotech Ltd's stock price is Rs. 1.22, reflecting a slight increase of 0.83%, but it has experienced significant declines over the past week, month, and year. Despite increased investor participation, the stock remains underperforming and is trading below its moving averages, indicating a bearish trend.

As of 24-Mar, Vikas Ecotech Ltd is experiencing a slight rise in its stock price, currently at Rs. 1.22, which reflects an increase of Rs. 0.01 or 0.83%. However, this upward movement occurs against a backdrop of significant declines over various time periods. The stock has fallen by 3.94% over the past week, 17.57% over the past month, and a substantial 50.41% over the past year. Additionally, it has reached a new 52-week low of Rs. 1.16 today.<BR><BR>Despite the current price increase, Vikas Ecotech is underperforming compared to the broader market, as indicated by its performance today, which lagged behind its sector by 1.56%. The stock is also trading below its moving averages across multiple time frames, including the 5-day, 20-day, 50-day, 100-day, and 200-day averages, suggesting a bearish trend.<BR><BR>On a more positive note, there has been a rise in investor participation, with delivery volume increasing by 21.54% compared to the 5-day average, indicating some level of interest from investors. However, the overall liquidity remains low, with the stock being liquid enough for trade sizes of Rs. 0.01 crore based on 2% of the 5-day average traded value.<BR><BR>In summary, while Vikas Ecotech Ltd's stock price has seen a minor rise today, it is still facing significant downward pressure from its historical performance and market trends.

View full answer

Why is Vikas Ecotech Ltd falling/rising?

25-Mar-2026

As of 25-Mar, Vikas Ecotech Ltd's stock price is Rs. 1.20, reflecting a significant decline of 50.41% over the past year, underperforming against the Sensex. The stock is currently at a 52-week low and trading below all key moving averages, indicating bearish sentiment and reduced investor participation.

As of 25-Mar, Vikas Ecotech Ltd's stock price is falling, currently at Rs. 1.20, which reflects a decrease of Rs. 0.01 or 0.83%. The stock has underperformed significantly compared to the benchmark Sensex, with a one-week decline of 9.09% versus the Sensex's 1.87% drop, and a one-month decline of 18.37% compared to the Sensex's 8.51% decline. Year-to-date, the stock has decreased by 28.57%, while the Sensex has only fallen by 11.67%. Over the past year, Vikas Ecotech has experienced a substantial decline of 50.41%, in stark contrast to the Sensex's modest 3.52% decline.<BR><BR>Today, the stock hit a new 52-week low of Rs. 1.16, indicating a continued downward trend. Additionally, it is trading below all key moving averages, including the 5-day, 20-day, 50-day, 100-day, and 200-day averages, which suggests a bearish sentiment among investors. There has also been a notable decrease in investor participation, with delivery volume falling by 23.12% compared to the 5-day average. This decline in trading activity further supports the notion that the stock is facing challenges, contributing to its falling price.

View full answer
iScoreScore
Click here to find our call on this stock
Strong Sell
Sell
Hold
Buy
Strong Buy

Dashboard

1

Weak Long Term Fundamental Strength with a -38.76% CAGR growth in Operating Profits over the last 5 years

  • Low ability to service debt as the company has a high Debt to EBITDA ratio of 3.02 times
  • The company has been able to generate a Return on Equity (avg) of 5.45% signifying low profitability per unit of shareholders funds
2

With a fall in Net Sales of -22.71%, the company declared Very Negative results in Dec 25
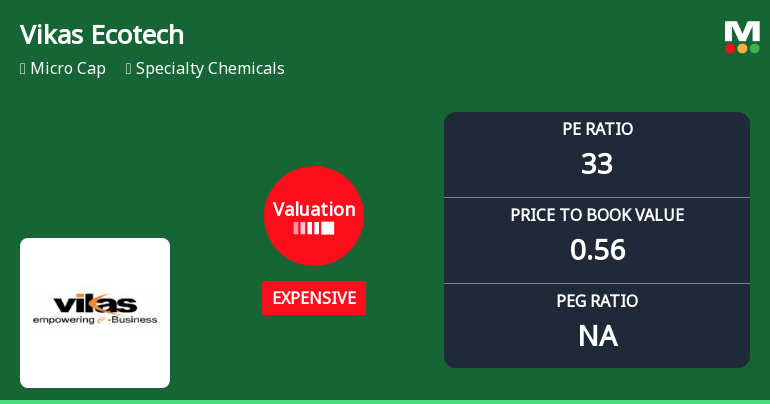
3

With ROE of 2, it has a Very Expensive valuation with a 0.5 Price to Book Value

4

Consistent Underperformance against the benchmark over the last 3 years

stock-summaryMojo Parameters

Mojo Parameters

Loading Valuation Snapshot...

Stock DNA

stock-summary
Industry

Specialty Chemicals

stock-summary
Market cap

INR 219 Cr (Micro Cap)

stock-summary
P/E

31.00

stock-summary
Industry P/E

37

stock-summary
Dividend Yield

0.00%

stock-summary
Debt Equity

0.09

stock-summary
Return on Equity

1.98%

stock-summary
Price to Book

0.54

Revenue and Profits:
Net Sales:
69 Cr
(Quarterly Results - Dec 2025)
Net Profit:
-2 Cr
stock-summaryTotal Returns
Total Returns (Price + Dividend) stock-summary
Dividend Yield (0%)
TimePeriod
Price Return
Dividend Return
Total Return
3 Months
-33.33%
0%
-33.33%
6 Months
-40.59%
0%
-40.59%
1 Year
-50.41%
0%
-50.41%
2 Years
-67.48%
0%
-67.48%
3 Years
-55.88%
0%
-55.88%
4 Years
-79.38%
0%
-79.38%
5 Years
-44.44%
0%
-44.44%

Latest dividend: 0.05 per share ex-dividend date: Sep-19-2019

Risk Adjusted Returns v/s stock-summary
Returns Beta
Icon
Beta has not been calculated since enough price history is not available
stock-summaryNews & Corporate Actions

Announcements stock-summary

Sub: Outcome Of Board Meeting Held On Thursday February 05 2026 Ref: Unaudited Financial Results For The Quarter Ended December 31 2025

05-Feb-2026 | Source : BSE

Sub: Outcome of Board Meeting held on Thursday February 05 2026 Ref: Unaudited Financial Results for the quarter ended December 31 2025

Board Meeting Outcome for Sub: Outcome Of Board Meeting Held On Thursday February 05 2026 Ref: Unaudited Financial Results For The Quarter Ended December 31 2025

05-Feb-2026 | Source : BSE

Sub: Outcome of Board Meeting held on Thursday February 05 2026 Ref: Unaudited Financial Results for the quarter ended December 31 2025

Board Meeting Intimation for Intimation Of Board Meeting To Be Held On Thursday February 05 2026

30-Jan-2026 | Source : BSE

Vikas Ecotech Ltdhas informed BSE that the meeting of the Board of Directors of the Company is scheduled on 05/02/2026 inter alia to consider and approve Intimation of Board Meeting to be held on Thursday February 05 2026

Corporate Actions stock-summary

stock-summary
BOARD MEETING

No Upcoming Board Meetings

stock-summary
DIVIDEND

Vikas Ecotech Ltd has declared 5% dividend, ex-date: 19 Sep 19

stock-summary
SPLITS

Vikas Ecotech Ltd has announced 1:10 stock split, ex-date: 27 Mar 14

stock-summary
BONUS

Vikas Ecotech Ltd has announced 3:2 bonus issue, ex-date: 13 Nov 14

stock-summary
RIGHTS

Vikas Ecotech Ltd has announced 12:25 rights issue, ex-date: 24 Nov 21

stock-summaryKey Factors

Quality key factors stock-summary

Factor
Value
Sales Growth (5y)
-3.20%
EBIT Growth (5y)
-38.76%
EBIT to Interest (avg)
1.57
Debt to EBITDA (avg)
2.16
Net Debt to Equity (avg)
0.09
Sales to Capital Employed (avg)
0.72
Tax Ratio
26.63%
Dividend Payout Ratio
14.07%
Pledged Shares
0.04%
Institutional Holding
0.00%
ROCE (avg)
2.09%
ROE (avg)
5.45%

Valuation key factors

Factor
Value
P/E Ratio
31
Industry P/E
37
Price to Book Value
0.53
EV to EBIT
32.80
EV to EBITDA
18.93
EV to Capital Employed
0.57
EV to Sales
0.73
PEG Ratio
NA
Dividend Yield
NA
ROCE (Latest)
1.50%
ROE (Latest)
1.98%

Technicals key factors

Indicator
Weekly
Monthly
MACD
Bearish
Bearish
RSI
No Signal
No Signal
Bollinger Bands
Bearish
Bearish
Moving Averages
Bearish (Daily)
KST
Bearish
Bearish
Dow Theory
Mildly Bearish
Mildly Bearish
OBV
Bearish
Bearish
stock-summary Technical Indicator Scale: Bearish, Mildly Bearish, Sideways, Mildly Bullish, Bullish  Turned 
stock-summaryShareholding
Shareholding Snapshot : Dec 2025stock-summary
Shareholding Compare (%holding) stock-summary
Majority shareholders

Non Institution

Pledged Promoter Holdings

0.0364

Mutual Funds

Held by 0 Schemes

FIIs

Held by 2 FIIs (0.0%)

Promoter with highest holding

Vikas Garg (10.1%)

Highest Public shareholder

J B Rolling Mills Limited (4.18%)

Individual Investors Holdings

75.14%

stock-summaryFinancial
[
  {
    "link": "quarterly",
    "btn_text": "All Quarterly Results",
    "header": "Quarterly Results Snapshot (Consolidated) - Dec'25 - QoQ",
    "rhs": [
      {
        "prefix": "Net Sales ",
        "suffix": "QoQ Growth in quarter ended Dec 2025 is 6.18% vs -37.50% in Sep 2025",
        "dir": 1
      },
      {
        "prefix": "Consolidated Net Profit ",
        "suffix": "QoQ Growth in quarter ended Dec 2025 is -194.86% vs -26.16% in Sep 2025",
        "dir": -1
      }
    ],
    "table": {
      "header": [
        "Dec'25",
        "Sep'25",
        "Change(%)"
      ],
      "body": [
        {
          "field": "Net Sales",
          "val1": "68.72",
          "val2": "64.72",
          "chgp": "6.18%",
          "chgp_class": "positive"
        },
        {
          "field": "Operating Profit (PBDIT) excl Other Income",
          "val1": "2.05",
          "val2": "2.67",
          "chgp": "-23.22%",
          "chgp_class": "negative"
        },
        {
          "field": "Interest",
          "val1": "1.55",
          "val2": "1.14",
          "chgp": "35.96%",
          "chgp_class": "negative"
        },
        {
          "field": "Exceptional Items",
          "val1": "0.00",
          "val2": "0.00",
          "chgp": "",
          "chgp_class": "neutral"
        },
        {
          "field": "Consolidate Net Profit",
          "val1": "-1.66",
          "val2": "1.75",
          "chgp": "-194.86%",
          "chgp_class": "negative"
        },
        {
          "field": "Operating Profit Margin (Excl OI)",
          "val1": "2.98%",
          "val2": "4.13%",
          "chgp": "-1.15%",
          "chgp_class": "negative"
        }
      ]
    }
  },
  {
    "link": "half-yearly",
    "btn_text": "All Half Yearly Results",
    "header": "Half Yearly Results Snapshot (Consolidated) - Sep'25",
    "rhs": [
      {
        "prefix": "Net Sales ",
        "suffix": " Growth in half year ended Sep 2025 is -11.57% vs 60.66% in Sep 2024",
        "dir": -1
      },
      {
        "prefix": "Consolidated Net Profit ",
        "suffix": " Growth in half year ended Sep 2025 is -68.86% vs 298.49% in Sep 2024",
        "dir": -1
      }
    ],
    "table": {
      "header": [
        "Sep'25",
        "Sep'24",
        "Change(%)"
      ],
      "body": [
        {
          "field": "Net Sales",
          "val1": "168.27",
          "val2": "190.29",
          "chgp": "-11.57%",
          "chgp_class": "negative"
        },
        {
          "field": "Operating Profit (PBDIT) excl Other Income",
          "val1": "7.35",
          "val2": "6.92",
          "chgp": "6.21%",
          "chgp_class": "positive"
        },
        {
          "field": "Interest",
          "val1": "2.32",
          "val2": "1.77",
          "chgp": "31.07%",
          "chgp_class": "negative"
        },
        {
          "field": "Exceptional Items",
          "val1": "0.00",
          "val2": "0.00",
          "chgp": "",
          "chgp_class": "neutral"
        },
        {
          "field": "Consolidate Net Profit",
          "val1": "4.12",
          "val2": "13.23",
          "chgp": "-68.86%",
          "chgp_class": "negative"
        },
        {
          "field": "Operating Profit Margin (Excl OI)",
          "val1": "4.37%",
          "val2": "3.64%",
          "chgp": "0.73%",
          "chgp_class": "positive"
        }
      ]
    }
  },
  {
    "link": "nine-monthly",
    "btn_text": "All Nine Monthly Results",
    "header": "Nine Monthly Results Snapshot (Consolidated) - Dec'25",
    "rhs": [
      {
        "prefix": "Net Sales ",
        "suffix": "YoY Growth in nine months ended Dec 2025 is -13.84% vs 47.16% in Dec 2024",
        "dir": -1
      },
      {
        "prefix": "Consolidated Net Profit ",
        "suffix": "YoY Growth in nine months ended Dec 2025 is -80.60% vs 178.68% in Dec 2024",
        "dir": -1
      }
    ],
    "table": {
      "header": [
        "Dec'25",
        "Dec'24",
        "Change(%)"
      ],
      "body": [
        {
          "field": "Net Sales",
          "val1": "236.99",
          "val2": "275.05",
          "chgp": "-13.84%",
          "chgp_class": "negative"
        },
        {
          "field": "Operating Profit (PBDIT) excl Other Income",
          "val1": "9.40",
          "val2": "8.29",
          "chgp": "13.39%",
          "chgp_class": "positive"
        },
        {
          "field": "Interest",
          "val1": "3.87",
          "val2": "2.86",
          "chgp": "35.31%",
          "chgp_class": "negative"
        },
        {
          "field": "Exceptional Items",
          "val1": "0.00",
          "val2": "0.00",
          "chgp": "",
          "chgp_class": "neutral"
        },
        {
          "field": "Consolidate Net Profit",
          "val1": "2.46",
          "val2": "12.68",
          "chgp": "-80.60%",
          "chgp_class": "negative"
        },
        {
          "field": "Operating Profit Margin (Excl OI)",
          "val1": "3.97%",
          "val2": "3.01%",
          "chgp": "0.96%",
          "chgp_class": "positive"
        }
      ]
    }
  },
  {
    "link": "annual",
    "btn_text": "All Annual Results",
    "header": "Annual Results Snapshot (Consolidated) - Mar'25",
    "rhs": [
      {
        "prefix": "Net Sales ",
        "suffix": "YoY Growth in year ended Mar 2025 is 46.03% vs -35.77% in Mar 2024",
        "dir": 1
      },
      {
        "prefix": "Consolidated Net Profit ",
        "suffix": "YoY Growth in year ended Mar 2025 is 147.88% vs -28.12% in Mar 2024",
        "dir": 1
      }
    ],
    "table": {
      "header": [
        "Mar'25",
        "Mar'24",
        "Change(%)"
      ],
      "body": [
        {
          "field": "Net Sales",
          "val1": "377.67",
          "val2": "258.63",
          "chgp": "46.03%",
          "chgp_class": "positive"
        },
        {
          "field": "Operating Profit (PBDIT) excl Other Income",
          "val1": "11.95",
          "val2": "15.95",
          "chgp": "-25.08%",
          "chgp_class": "negative"
        },
        {
          "field": "Interest",
          "val1": "4.15",
          "val2": "6.58",
          "chgp": "-36.93%",
          "chgp_class": "positive"
        },
        {
          "field": "Exceptional Items",
          "val1": "12.87",
          "val2": "0.00",
          "chgp": "",
          "chgp_class": "neutral"
        },
        {
          "field": "Consolidate Net Profit",
          "val1": "16.98",
          "val2": "6.85",
          "chgp": "147.88%",
          "chgp_class": "positive"
        },
        {
          "field": "Operating Profit Margin (Excl OI)",
          "val1": "3.16%",
          "val2": "6.17%",
          "chgp": "-3.01%",
          "chgp_class": "negative"
        }
      ]
    }
  }
]

Quarterly Results Snapshot (Consolidated) - Dec'25 - QoQstock-summary

Dec'25
Sep'25
Change(%)
Net Sales
68.72
64.72
6.18%
Operating Profit (PBDIT) excl Other Income
2.05
2.67
-23.22%
Interest
1.55
1.14
35.96%
Exceptional Items
0.00
0.00
Consolidate Net Profit
-1.66
1.75
-194.86%
Operating Profit Margin (Excl OI)
2.98%
4.13%
-1.15%
Values in Rs Cr.
Direction Arrows
Net Sales

QoQ Growth in quarter ended Dec 2025 is 6.18% vs -37.50% in Sep 2025

Direction Arrows
Consolidated Net Profit

QoQ Growth in quarter ended Dec 2025 is -194.86% vs -26.16% in Sep 2025

Half Yearly Results Snapshot (Consolidated) - Sep'25stock-summary

Sep'25
Sep'24
Change(%)
Net Sales
168.27
190.29
-11.57%
Operating Profit (PBDIT) excl Other Income
7.35
6.92
6.21%
Interest
2.32
1.77
31.07%
Exceptional Items
0.00
0.00
Consolidate Net Profit
4.12
13.23
-68.86%
Operating Profit Margin (Excl OI)
4.37%
3.64%
0.73%
Values in Rs Cr.
Direction Arrows
Net Sales

Growth in half year ended Sep 2025 is -11.57% vs 60.66% in Sep 2024

Direction Arrows
Consolidated Net Profit

Growth in half year ended Sep 2025 is -68.86% vs 298.49% in Sep 2024

Nine Monthly Results Snapshot (Consolidated) - Dec'25stock-summary

Dec'25
Dec'24
Change(%)
Net Sales
236.99
275.05
-13.84%
Operating Profit (PBDIT) excl Other Income
9.40
8.29
13.39%
Interest
3.87
2.86
35.31%
Exceptional Items
0.00
0.00
Consolidate Net Profit
2.46
12.68
-80.60%
Operating Profit Margin (Excl OI)
3.97%
3.01%
0.96%
Values in Rs Cr.
Direction Arrows
Net Sales

YoY Growth in nine months ended Dec 2025 is -13.84% vs 47.16% in Dec 2024

Direction Arrows
Consolidated Net Profit

YoY Growth in nine months ended Dec 2025 is -80.60% vs 178.68% in Dec 2024

Annual Results Snapshot (Consolidated) - Mar'25stock-summary

Mar'25
Mar'24
Change(%)
Net Sales
377.67
258.63
46.03%
Operating Profit (PBDIT) excl Other Income
11.95
15.95
-25.08%
Interest
4.15
6.58
-36.93%
Exceptional Items
12.87
0.00
Consolidate Net Profit
16.98
6.85
147.88%
Operating Profit Margin (Excl OI)
3.16%
6.17%
-3.01%
Values in Rs Cr.
Direction Arrows
Net Sales

YoY Growth in year ended Mar 2025 is 46.03% vs -35.77% in Mar 2024

Direction Arrows
Consolidated Net Profit

YoY Growth in year ended Mar 2025 is 147.88% vs -28.12% in Mar 2024

stock-summaryCompany CV
About Vikas Ecotech Ltd stock-summary
stock-summary
Vikas Ecotech Ltd
Micro Cap
Specialty Chemicals
Vikas Ecotech Limited was originally incorporated on November 30, 1984 as "Vikas Leasing Limited" with the Registrar of Companies, Delhi and Haryana. The name of Company was changed from "Vikas Leasing Limited" to "Vikas Profin Limited" and a fresh Certificate of Incorporation was issued on January 7, 2002. Thereafter, the name was again changed from "Vikas Profin Limited" to "Vikas Globalone Limited" on December 31, 2008.
Company Coordinates stock-summary
Company Details
Vikas Apartments, 34/1 East Punjabi Bagh New Delhi New Delhi : 110026
stock-summary
Tel: 91-011-43144444
stock-summary
investor@vikasglobal.in
Registrar Details
Alankit Assignments Ltd , Alankit House , 2 E/21, Jhandewala Extension, New Delhi