
Compare SRF with Similar Stocks
Stock DNA
Specialty Chemicals
INR 80,199 Cr (Mid Cap)
42.00
95
0.33%
0.28
13.63%
5.71
Total Returns (Price + Dividend) 
Latest dividend: 5.00522017972333 per share ex-dividend date: Jan-27-2026
Risk Adjusted Returns v/s
Returns Beta

News
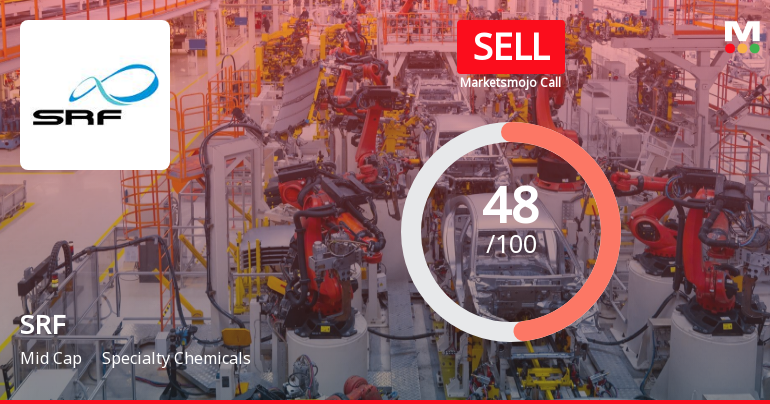
SRF Ltd. is Rated Sell by MarketsMOJO
SRF Ltd. is rated 'Sell' by MarketsMOJO, with this rating last updated on 18 May 2026. However, the analysis and financial metrics discussed here reflect the stock's current position as of 21 June 2026, providing investors with the most up-to-date view of the company’s fundamentals, returns, and market performance.
Read full news article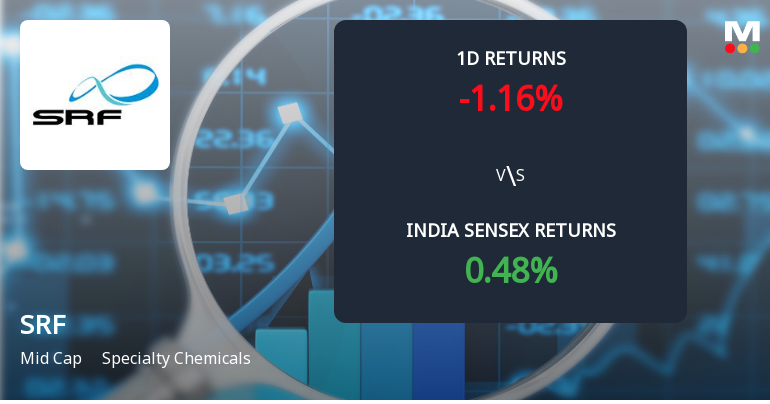
SRF Ltd. Sees Sharp Open Interest Surge Amid Mixed Market Signals
SRF Ltd., a mid-cap player in the specialty chemicals sector, witnessed a significant 18.6% rise in open interest (OI) in its derivatives segment on 16 June 2026, signalling heightened market activity and shifting investor positioning. Despite this surge, the stock underperformed its sector and broader indices, reflecting a complex interplay of market forces and investor sentiment.
Read full news article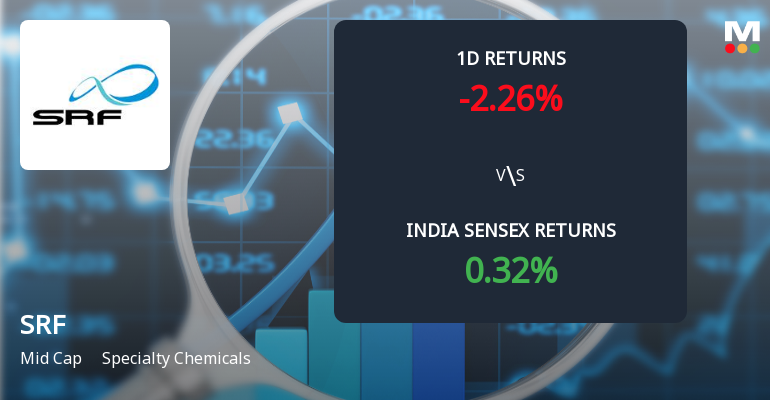
SRF Ltd. Sees Sharp Open Interest Surge Amid Bearish Price Action
SRF Ltd., a mid-cap player in the Specialty Chemicals sector, witnessed a significant 18.36% rise in open interest (OI) in its derivatives segment on 16 June 2026, signalling heightened market activity and shifting investor positioning. Despite this surge, the stock underperformed its sector and broader indices, reflecting a complex interplay of bearish sentiment and speculative bets.
Read full news article Announcements
Announcement under Regulation 30 (LODR)-Newspaper Publication
08-Jun-2026 | Source : BSENewspaper Advertisement
Reg. 34 (1) Annual Report.
06-Jun-2026 | Source : BSEAnnual Report
Disclosure Under Regulation 30 Of The SEBI (Listing Obligations And Disclosure Requirements) Regulations 2015
06-Jun-2026 | Source : BSELetter to Shareholders
Corporate Actions

No Upcoming Board Meetings

SRF Ltd. has declared 50% dividend, ex-date: 27 Jan 26

No Splits history available

SRF Ltd. has announced 4:1 bonus issue, ex-date: 13 Oct 21

No Rights history available
Quality key factors
Valuation key factors
Technicals key factors
 Technical Indicator Scale: Bearish, Mildly Bearish, Sideways, Mildly Bullish, Bullish Turned
 Shareholding Snapshot : Mar 2026
Shareholding Compare (%holding)
Promoters
None
Held by 34 Schemes (12.33%)
Held by 523 FIIs (16.66%)
Kama Holdings Limited (50.21%)
Kotak Mahindra Trustee Co Ltd A/c Kotak Nifty Midc (4.92%)
8.83%
Quarterly Results Snapshot (Consolidated) - Mar'26 - QoQ

QoQ Growth in quarter ended Mar 2026 is 24.31% vs 1.99% in Dec 2025
QoQ Growth in quarter ended Mar 2026 is 34.52% vs 11.46% in Dec 2025
Half Yearly Results Snapshot (Consolidated) - Sep'25
Growth in half year ended Sep 2025 is 8.28% vs 5.72% in Sep 2024
Growth in half year ended Sep 2025 is 80.87% vs -31.27% in Sep 2024
Nine Monthly Results Snapshot (Consolidated) - Dec'25

YoY Growth in nine months ended Dec 2025 is 7.63% vs 8.47% in Dec 2024
YoY Growth in nine months ended Dec 2025 is 72.92% vs -20.67% in Dec 2024
Annual Results Snapshot (Consolidated) - Mar'26
YoY Growth in year ended Mar 2026 is 7.44% vs 11.83% in Mar 2025
YoY Growth in year ended Mar 2026 is 46.72% vs -6.36% in Mar 2025
About SRF Ltd.

Company Coordinates


