
Compare Ginni Filaments with Similar Stocks
Dashboard
Weak Long Term Fundamental Strength with a -11.76% CAGR growth in Operating Profits over the last 5 years
- Low ability to service debt as the company has a high Debt to EBITDA ratio of 0.61 times
- The company has been able to generate a Return on Equity (avg) of 8.59% signifying low profitability per unit of shareholders funds
Negative results in Jun 26
Stock DNA
Garments & Apparels
INR 385 Cr (Micro Cap)
11.00
24
0.00%
0.07
14.99%
1.66
Total Returns (Price + Dividend) 
Latest dividend: 0.4200 per share ex-dividend date: Mar-21-2007
Risk Adjusted Returns v/s
Returns Beta

News
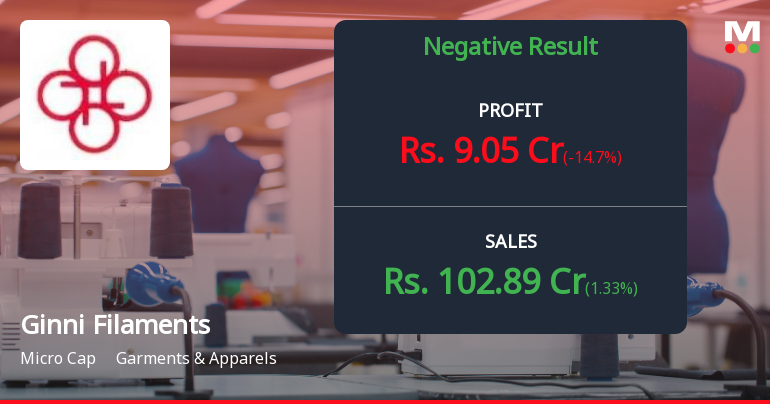
Ginni Filaments Q1 FY27: Profit Plunges 38.64% Despite Revenue Growth
Ginni Filaments Ltd., an integrated textiles manufacturer, reported a concerning decline in profitability for Q1 FY27, with net profit falling 38.64% year-on-year to ₹9.05 crores despite modest revenue growth. The micro-cap garment and apparel company, with a market capitalisation of ₹428.00 crores, saw its stock decline 4.94% to ₹46.40 on July 28, 2026, reflecting investor disappointment with the earnings quality deterioration.
Read full news article
Ginni Filaments Ltd is Rated Sell
Ginni Filaments Ltd is rated 'Sell' by MarketsMOJO, with this rating last updated on 09 June 2026. However, the analysis and financial metrics discussed here reflect the stock's current position as of 25 July 2026, providing investors with an up-to-date view of the company’s fundamentals, valuation, financial trends, and technical outlook.
Read full news article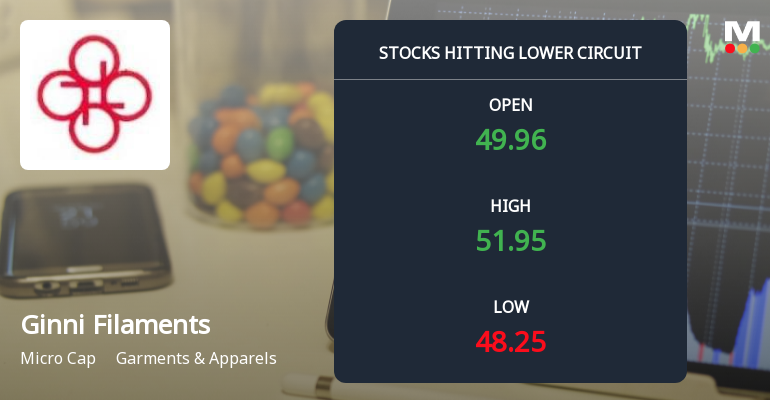
Ginni Filaments Ltd Locks at Lower Circuit With 1.89% Loss — Sellers Queue, No Buyers in Sight
At Rs 48.85, Ginni Filaments Ltd found sellers still queuing but no buyers willing to step in, resulting in the stock locking at its lower circuit limit of 1.89% on 22 Jul 2026. This freeze at the floor price reflects unfilled supply and a market unable to absorb the selling pressure.
Read full news article Announcements
Announcement under Regulation 30 (LODR)-Newspaper Publication
30-Jul-2026 | Source : BSECopy of Newspapers regarding publication of Unaudited quarter results for 30th June 2026.
Board Meeting Outcome for Unaudited Financial Results For Quarter Ended 30Th June2026
28-Jul-2026 | Source : BSEunaudited financial results for quarter ended 30th June2026
Board Meeting Intimation for To Consider The Un Audited Financial Results For The Quarter Ended 30Th June 2026.
08-Jul-2026 | Source : BSEGinni Filaments Ltdhas informed BSE that the meeting of the Board of Directors of the Company is scheduled on 28/07/2026 inter alia to consider and approve To consider the Un Audited financial results for the quarter ended 30th June 2026.
Corporate Actions

No Upcoming Board Meetings

Ginni Filaments Ltd has declared 5% dividend, ex-date: 21 Mar 07

No Splits history available

No Bonus history available

No Rights history available
Quality key factors
Valuation key factors
Technicals key factors
 Technical Indicator Scale: Bearish, Mildly Bearish, Sideways, Mildly Bullish, Bullish Turned
 Shareholding Snapshot : Jun 2026
Shareholding Compare (%holding)
Promoters
17.4293
Held by 1 Schemes (0.0%)
Held by 1 FIIs (0.02%)
Raghukul Trading Private Limited (23.36%)
Zaki Abbas Nasser (1.78%)
25.34%
Quarterly Results Snapshot (Standalone) - Jun'26 - YoY

YoY Growth in quarter ended Jun 2026 is 1.33% vs 62.31% in Jun 2025
YoY Growth in quarter ended Jun 2026 is -14.70% vs 35,266.67% in Jun 2025
Half Yearly Results Snapshot (Standalone) - Sep'25

Growth in half year ended Sep 2025 is 14.93% vs 2.86% in Sep 2024
Growth in half year ended Sep 2025 is 20,770.00% vs 100.51% in Sep 2024
Nine Monthly Results Snapshot (Standalone) - Dec'25
YoY Growth in nine months ended Dec 2025 is 13.15% vs -2.70% in Dec 2024
YoY Growth in nine months ended Dec 2025 is 5,169.49% vs 98.25% in Dec 2024
Annual Results Snapshot (Standalone) - Mar'26
YoY Growth in year ended Mar 2026 is 26.19% vs -14.53% in Mar 2025
YoY Growth in year ended Mar 2026 is 781.90% vs 104.97% in Mar 2025
About Ginni Filaments Ltd

Company Coordinates


