
Compare Sharda Cropchem with Similar Stocks
Stock DNA
Pesticides & Agrochemicals
INR 7,418 Cr (Small Cap)
12.00
29
1.45%
-0.19
21.71%
2.38
Total Returns (Price + Dividend) 
Latest dividend: 6 per share ex-dividend date: Feb-06-2026
Risk Adjusted Returns v/s
Returns Beta

News
Are Sharda Cropchem Ltd latest results good or bad?
Sharda Cropchem Ltd's latest financial results for Q1 FY27 indicate a complex operational landscape. The company reported a net profit of ₹88.04 crore, reflecting a significant decline of 38.34% year-on-year, which raises concerns about profitability despite a modest revenue growth of 9.03%, reaching ₹1,073.77 crore. This revenue growth is a notable contrast to the previous year's performance, where revenue growth was substantially higher at 25.44%. The results reveal significant margin compression, with the operating profit margin (excluding other income) contracting to 17.32% from 21.86% in the same quarter last year. This 454 basis point decline suggests challenges in maintaining pricing power or managing rising input costs effectively. Additionally, the profit after tax (PAT) margin also saw a sharp contraction to 8.20%, down from 14.50% a year ago, indicating that the company's profitability is under ...
Read full news article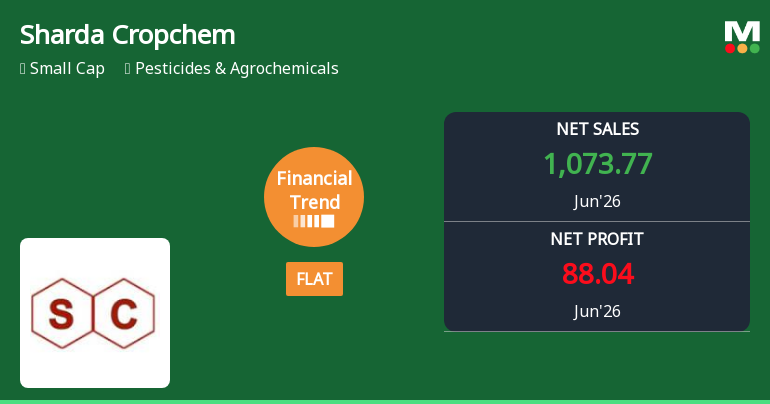
Sharda Cropchem Ltd Reports Flat Quarterly Performance Amid Margin Pressures
Sharda Cropchem Ltd, a key player in the Pesticides & Agrochemicals sector, has reported a flat financial performance for the quarter ended June 2026, marking a significant shift from its previously outstanding growth trajectory. Despite robust operating cash flows and return on capital employed, the company’s quarterly profit before tax and net profit have contracted sharply, signalling emerging challenges in margin sustainability and operational efficiency.
Read full news article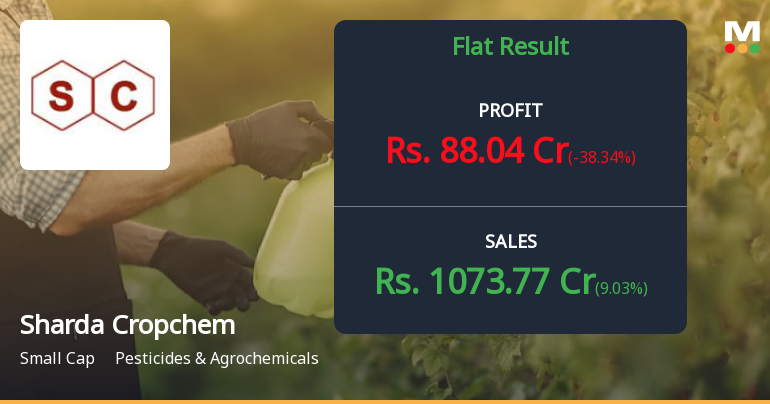
Sharda Cropchem Q1 FY27: Sharp Profit Decline Raises Margin Concerns
Sharda Cropchem Ltd., a prominent player in the pesticides and agrochemicals sector, reported a disappointing first quarter for FY2027, with consolidated net profit declining 38.34% year-on-year to ₹88.04 crores from ₹142.78 crores in Q1 FY26. The sequential decline was even steeper at 72.37% from ₹318.64 crores in Q4 FY26. The stock reacted negatively to the results, declining 5.58% to ₹825.05 on July 29, 2026, extending its year-to-date losses to 5.63% and one-year losses to 28.53%.
Read full news article Announcements
Announcement under Regulation 30 (LODR)-Analyst / Investor Meet - Intimation
22-Jul-2026 | Source : BSEThe Company has scheduled a Conference call for analyst and investors on Thursday 30th July 2026 at 03.30 P.M. IST.
Board Meeting Intimation for Adoption Of Unaudited Standalone & Consolidated Financial Results For The Quarter Ended 30Th June 2026.
21-Jul-2026 | Source : BSESharda Cropchem Ltdhas informed BSE that the meeting of the Board of Directors of the Company is scheduled on 29/07/2026 inter alia to consider and approve Unaudited Standalone & Consolidated Financial Results for the quarter ended 30th June 2026.
Announcement under Regulation 30 (LODR)-Newspaper Publication
15-Jul-2026 | Source : BSENewspaper Advertisement - 23rd Annual General Meeting of the Company
Corporate Actions

No Upcoming Board Meetings

Sharda Cropchem Ltd has declared 90% dividend, ex-date: 07 Aug 26

No Splits history available

No Bonus history available

No Rights history available
Quality key factors
Valuation key factors
Technicals key factors
 Technical Indicator Scale: Bearish, Mildly Bearish, Sideways, Mildly Bullish, Bullish Turned
 Shareholding Snapshot : Jun 2026
Shareholding Compare (%holding)
Promoters
None
Held by 9 Schemes (8.88%)
Held by 95 FIIs (3.11%)
Ashish Ramprakash Bubna (16.83%)
Hdfc Small Cap Fund (7.1%)
9.83%
Quarterly Results Snapshot (Consolidated) - Jun'26 - YoY

YoY Growth in quarter ended Jun 2026 is 9.03% vs 25.44% in Jun 2025
YoY Growth in quarter ended Jun 2026 is -38.34% vs 423.96% in Jun 2025
Half Yearly Results Snapshot (Consolidated) - Sep'25
Growth in half year ended Sep 2025 is 22.53% vs 28.19% in Sep 2024

Growth in half year ended Sep 2025 is 211.66% vs 159.94% in Sep 2024
Nine Monthly Results Snapshot (Consolidated) - Dec'25
YoY Growth in nine months ended Dec 2025 is 28.55% vs 34.60% in Dec 2024
YoY Growth in nine months ended Dec 2025 is 259.31% vs 190.35% in Dec 2024
Annual Results Snapshot (Consolidated) - Mar'26
YoY Growth in year ended Mar 2026 is 21.94% vs 36.57% in Mar 2025
YoY Growth in year ended Mar 2026 is 123.69% vs 854.77% in Mar 2025
About Sharda Cropchem Ltd

Company Coordinates


