
Compare Chola Financial with Similar Stocks
Dashboard
High Debt company with Weak Long Term Fundamental Strength
- High Debt Company with a Debt to Equity ratio (avg) of 9.49 times
- The company has been able to generate a Return on Capital Employed (avg) of 9.89% signifying low profitability per unit of total capital (equity and debt)
Underperformed the market in the last 1 year
Stock DNA
Non Banking Financial Company (NBFC)
INR 30,645 Cr (Mid Cap)
13.00
21
0.08%
12.65
15.80%
2.00
Total Returns (Price + Dividend) 
Latest dividend: 1.2968421627227817 per share ex-dividend date: Aug-01-2025
Risk Adjusted Returns v/s
Returns Beta

News
Cholamandalam Financial Holdings Ltd is Rated Sell
Cholamandalam Financial Holdings Ltd is rated Sell by MarketsMOJO. This rating was last updated on 11 May 2026. However, the analysis and financial metrics discussed here reflect the stock’s current position as of 25 June 2026, providing investors with the latest insights into the company’s performance and outlook.
Read full news article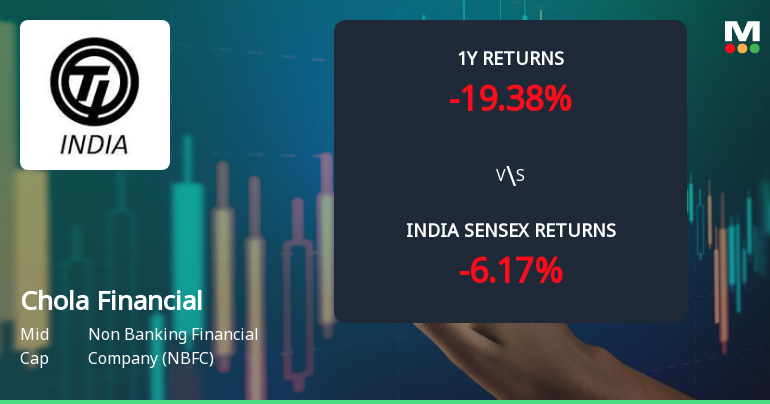
Cholamandalam Financial Holdings Ltd Technical Momentum Shifts Amid Mixed Signals
Cholamandalam Financial Holdings Ltd (Chola Financial), a mid-cap player in the Non Banking Financial Company (NBFC) sector, has experienced a notable shift in its technical parameters, reflecting a complex interplay of bullish and bearish signals. Despite a strong day gain of 3.97%, the stock’s technical indicators reveal a nuanced momentum landscape, prompting a downgrade in its Mojo Grade from Hold to Sell as of 11 May 2026.
Read full news article
Cholamandalam Financial Holdings Ltd Sees Mixed Technical Signals Amid Price Momentum Shift
Cholamandalam Financial Holdings Ltd (Chola Financial) has experienced a notable shift in its technical parameters, reflecting a complex interplay of bullish and bearish signals. Despite a strong day change of 7.02%, the stock’s technical indicators present a nuanced picture, with momentum oscillating between mildly bullish and bearish trends across different timeframes.
Read full news article Announcements
Contact Details Of Key Managerial Personnel Of The Company
15-Jun-2026 | Source : BSEContact details of Key Managerial Personnel of the Company authorised under Regulation 30(5) of the SEBI Listing Regulations 2015
Announcement under Regulation 30 (LODR)-Newspaper Publication
25-May-2026 | Source : BSECholamandalam Financial Holdings Limited has informed the exchange regarding copy of newspaper publication
Announcement under Regulation 30 (LODR)-Earnings Call Transcript
15-May-2026 | Source : BSECholamandalam Financial Holdings Limited has informed the exchange regarding transcript of investor meet
Corporate Actions

No Upcoming Board Meetings

Cholamandalam Financial Holdings Ltd has declared 130% dividend, ex-date: 01 Aug 25

Cholamandalam Financial Holdings Ltd has announced 2:10 stock split, ex-date: 31 May 06

No Bonus history available

No Rights history available
Quality key factors
Valuation key factors
Technicals key factors
 Technical Indicator Scale: Bearish, Mildly Bearish, Sideways, Mildly Bullish, Bullish Turned
 Shareholding Snapshot : Mar 2026
Shareholding Compare (%holding)
Promoters
0.0152
Held by 29 Schemes (23.62%)
Held by 238 FIIs (13.8%)
Ambadi Investments Limited (37.69%)
Nippon Life India Trustee Ltd- A/c Nippon India Gr (4.79%)
9.75%
Quarterly Results Snapshot (Consolidated) - Mar'26 - QoQ

QoQ Growth in quarter ended Mar 2026 is 4.20% vs 5.15% in Dec 2025
QoQ Growth in quarter ended Mar 2026 is 9.81% vs 13.79% in Dec 2025
Half Yearly Results Snapshot (Consolidated) - Sep'25
Growth in half year ended Sep 2025 is 19.30% vs 31.65% in Sep 2024
Growth in half year ended Sep 2025 is 5.08% vs 35.54% in Sep 2024
Nine Monthly Results Snapshot (Consolidated) - Dec'25
YoY Growth in nine months ended Dec 2025 is 18.56% vs 29.22% in Dec 2024
YoY Growth in nine months ended Dec 2025 is 12.44% vs 23.87% in Dec 2024
Annual Results Snapshot (Consolidated) - Mar'26
YoY Growth in year ended Mar 2026 is 17.95% vs 28.38% in Mar 2025
YoY Growth in year ended Mar 2026 is 12.31% vs 22.63% in Mar 2025
About Cholamandalam Financial Holdings Ltd

Company Coordinates


