
Compare Vindhya Telelink with Similar Stocks
Stock DNA
Telecom - Equipment & Accessories
INR 2,178 Cr (Small Cap)
10.00
46
0.86%
0.33
5.24%
0.52
Total Returns (Price + Dividend) 
Latest dividend: 16 per share ex-dividend date: Sep-04-2025
Risk Adjusted Returns v/s
Returns Beta

News
When is the next results date for Vindhya Telelinks Ltd?
The next results date for Vindhya Telelinks Ltd is scheduled for August 7, 2026....
Read full news article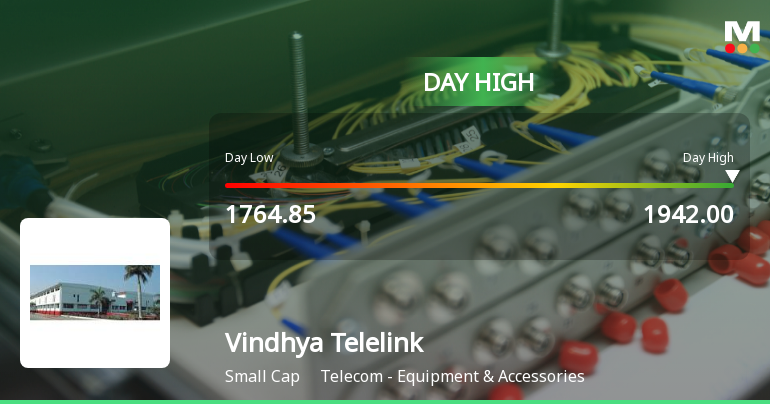
Vindhya Telelinks Ltd Surges 7.05% to Day's High of Rs 1942 — Outperforms Sector by 6.13 Percentage Points
The Sensex declined 0.31% on 21 Jul 2026 while Vindhya Telelinks Ltd surged 7.05%, marking a significant outperformance of 6.13 percentage points over its Telecom - Equipment & Accessories sector. This strong intraday gain rewrites the short-term narrative for the stock, which had been under pressure in recent weeks.
Read full news article
Vindhya Telelinks Ltd is Rated Sell
Vindhya Telelinks Ltd is rated 'Sell' by MarketsMOJO, with this rating last updated on 25 May 2026. However, the analysis and financial metrics discussed here reflect the stock's current position as of 21 July 2026, providing investors with an up-to-date perspective on the company’s performance and outlook.
Read full news article Announcements
Board Meeting Intimation for Board Meeting Intimation To Consider And Take On Record The Unaudited Standalone And Consolidated Financial Results Of The Company For The Quarter Ended On 30Th June 2026.
23-Jul-2026 | Source : BSEVindhya Telelinks Ltdhas informed BSE that the meeting of the Board of Directors of the Company is scheduled on 07/08/2026 inter alia to consider and approve Board Meeting Intimation to consider and take on record the Unaudited Standalone and Consolidated Financial Results of the Company for the Quarter ended on 30th June 2026.
Update on board meeting
23-Jul-2026 | Source : BSEThe Board Meeting to be held on 07/08/2026 has been revised to 07/08/2026 To consider and take on record the Unaudited Standalone and Consolidated Financial Results of the Company for the Quarter ended on 30th June 2026.
Announcement under Regulation 30 (LODR)-Newspaper Publication
11-Jul-2026 | Source : BSENewspaper Publication- Notice of 43rd Annual General Meeting of the Company.
Corporate Actions

07 Aug 2026

Vindhya Telelinks Ltd has declared 60% dividend, ex-date: 27 Jul 26

No Splits history available

No Bonus history available

No Rights history available
Quality key factors
Valuation key factors
Technicals key factors
 Technical Indicator Scale: Bearish, Mildly Bearish, Sideways, Mildly Bullish, Bullish Turned
 Shareholding Snapshot : Jun 2026
Shareholding Compare (%holding)
Non Institution
None
Held by 3 Schemes (8.23%)
Held by 45 FIIs (1.4%)
Universal Cables Limited (29.15%)
Belle Vue Clinic (9.82%)
21.86%
Quarterly Results Snapshot (Consolidated) - Mar'26 - YoY

YoY Growth in quarter ended Mar 2026 is -18.02% vs -4.56% in Mar 2025
YoY Growth in quarter ended Mar 2026 is -5.89% vs 1.47% in Mar 2025
Half Yearly Results Snapshot (Consolidated) - Sep'25

Growth in half year ended Sep 2025 is 4.55% vs 4.28% in Sep 2024
Growth in half year ended Sep 2025 is 118.81% vs -49.03% in Sep 2024
Nine Monthly Results Snapshot (Consolidated) - Dec'25
YoY Growth in nine months ended Dec 2025 is -8.48% vs 0.95% in Dec 2024
YoY Growth in nine months ended Dec 2025 is 25.62% vs -46.71% in Dec 2024
Annual Results Snapshot (Consolidated) - Mar'26
YoY Growth in year ended Mar 2026 is -11.38% vs -0.79% in Mar 2025
YoY Growth in year ended Mar 2026 is 8.55% vs -28.25% in Mar 2025
About Vindhya Telelinks Ltd

Company Coordinates


