
Compare Cochin Malabar with Similar Stocks
Dashboard
With a Negative Book Value, the company has a Weak Long Term Fundamental Strength
- Poor long term growth as Net Sales has grown by an annual rate of % and Operating profit at 0% over the last 5 years
- The company has a negative book value of Rs 2.11 crore
Flat results in Mar 26
Risky - Negative EBITDA
Below par performance in long term as well as near term
Stock DNA
Tyres & Rubber Products
INR 24 Cr (Micro Cap)
NA (Loss Making)
78
0.00%
-1.73
21.80%
-11.17
Total Returns (Price + Dividend) 
Cochin Malabar for the last several years.
Risk Adjusted Returns v/s
Returns Beta

News
Are Cochin Malabar Estates & Industries Ltd latest results good or bad?
Cochin Malabar Estates & Industries Ltd has reported significant operational challenges in its latest financial results for the quarter ended March 2026. The company recorded a net profit of -₹0.15 crores, marking a stark decline compared to a profit of ₹1.73 crores in the same quarter of the previous year, reflecting a year-on-year change of -108.67%. This reversal highlights the ongoing difficulties the company faces in generating revenue, as net sales remained effectively at zero for multiple quarters. The operating loss for the quarter was reported at -₹0.31 crores, which is the worst quarterly performance in recent history. The company has not been able to offset its operational losses with other income, which provided only marginal relief at ₹0.22 crores. The interest expenses of ₹0.10 crores further compounded the financial strain, leading to a total loss that underscores the critical operational br...
Read full news article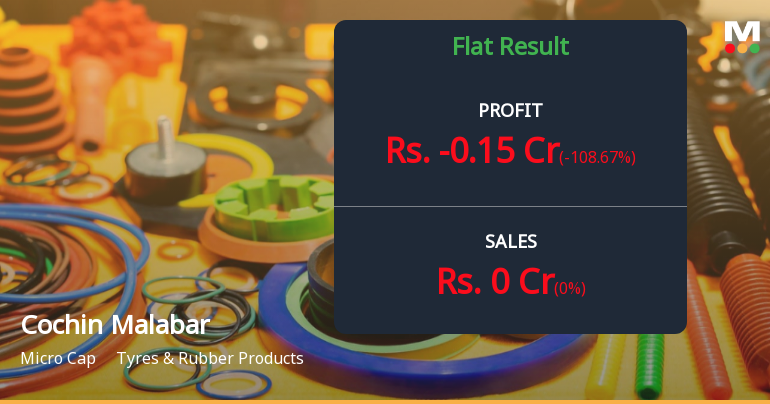
Cochin Malabar Estates: Mounting Losses Signal Deepening Crisis for Legacy Plantation Company
Cochin Malabar Estates & Industries Ltd., a 96-year-old rubber and tea plantation company, continues its troubling descent into sustained losses, reporting a net loss of ₹0.15 crores for the quarter ended March 2026. The micro-cap company, with a market capitalisation of just ₹25.00 crores, remains mired in operational difficulties as its shares trade at ₹139.20, down 22.67% over the past year and significantly underperforming the broader Tyres & Rubber Products sector by a staggering 132.58 percentage points.
Read full news article Announcements
Closure of Trading Window
23-Jun-2026 | Source : BSEIntimation of Closure of Trading Window for the quarter ended 30th June 2026.
Announcement under Regulation 30 (LODR)-Change in Management
12-Jun-2026 | Source : BSEIntimation under Regulation 30 of SEBI (LODR) Regulations 2015 - Re-appointment of Wholetime Director of the Company.
Announcement under Regulation 30 (LODR)-Newspaper Publication
22-May-2026 | Source : BSESubmission of Newspaper Advertisement of Audited Financial Results of the Company for the quarter and year ended 31st March 2026.
Corporate Actions

No Upcoming Board Meetings

No Dividend history available

No Splits history available

No Bonus history available

No Rights history available
Quality key factors
Valuation key factors
Technicals key factors
 Technical Indicator Scale: Bearish, Mildly Bearish, Sideways, Mildly Bullish, Bullish Turned
 Shareholding Snapshot : Mar 2026
Shareholding Compare (%holding)
Promoters
None
Held by 0 Schemes
Held by 0 FIIs
Shri Vasuprada Plantations Limited (24.68%)
Life Insurance Corporation Of India (16.77%)
18.91%
Quarterly Results Snapshot (Standalone) - Mar'26 - YoY
YoY Growth in quarter ended Mar 2026 is 0.00% vs 0.00% in Mar 2025

YoY Growth in quarter ended Mar 2026 is -108.67% vs 73.00% in Mar 2025
Half Yearly Results Snapshot (Standalone) - Sep'25
Growth in half year ended Sep 2025 is 0.00% vs 0.00% in Sep 2024

Growth in half year ended Sep 2025 is 35.48% vs 11.43% in Sep 2024
Nine Monthly Results Snapshot (Standalone) - Dec'25
YoY Growth in nine months ended Dec 2025 is 0.00% vs 0.00% in Dec 2024
YoY Growth in nine months ended Dec 2025 is 33.33% vs 10.00% in Dec 2024
Annual Results Snapshot (Standalone) - Mar'26
YoY Growth in year ended Mar 2026 is 0.00% vs 0.00% in Mar 2025
YoY Growth in year ended Mar 2026 is -135.94% vs 156.00% in Mar 2025
About Cochin Malabar Estates & Industries Ltd

Company Coordinates


