
Compare Coastal Corporat with Similar Stocks
Dashboard
Weak Long Term Fundamental Strength with an average Return on Capital Employed (ROCE) of 3.69%
- Poor long term growth as Operating profit has grown by an annual rate 15.24% of over the last 5 years
- Low ability to service debt as the company has a high Debt to EBITDA ratio of 7.95 times
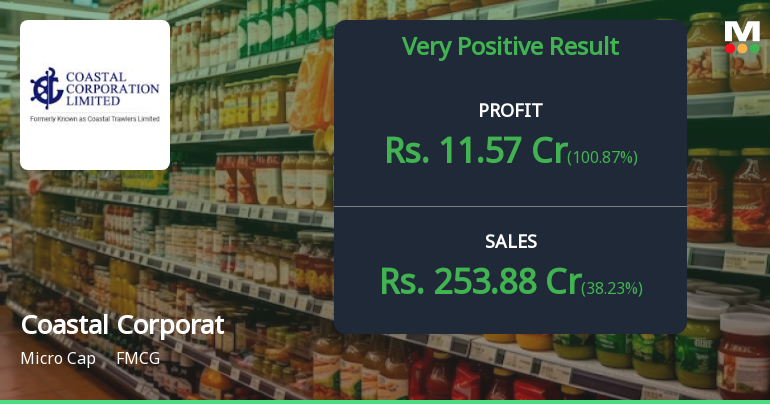
With a growth in Net Profit of 100.87%, the company declared Very Positive results in Jun 26
With ROCE of 6.4, it has a Attractive valuation with a 1.1 Enterprise value to Capital Employed
Majority shareholders : Non Institution
Market Beating Performance
Total Returns (Price + Dividend) 
Latest dividend: 0.23999999999999996 per share ex-dividend date: Sep-20-2024
Risk Adjusted Returns v/s
Returns Beta

News
Coastal Corporation Q1 FY27: Strong Profit Surge Masks Underlying Quality Concerns
Coastal Corporation Ltd., a Visakhapatnam-based shrimp exporter with a market capitalisation of ₹334.00 crores, reported a robust net profit of ₹11.57 crores for Q1 FY27, marking a 100.87% year-on-year surge and a 16.87% sequential improvement. The stock responded positively to the results, gaining 5.32% on August 3, 2026, to close at ₹51.50, though it remains 23.59% below its 52-week high of ₹67.40.
Read full news article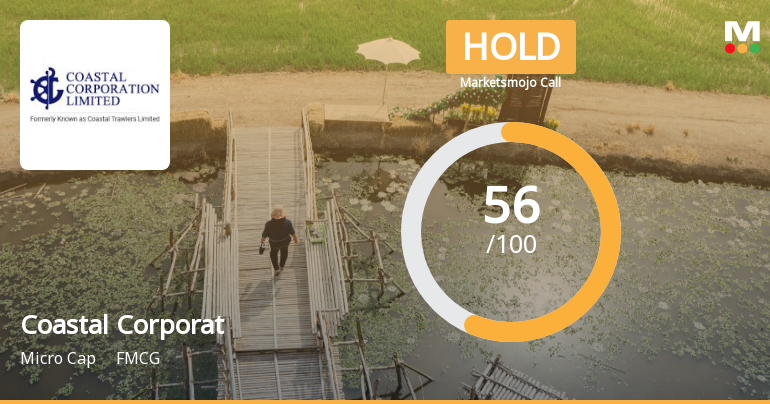
Coastal Corporation Ltd is Rated Hold
Coastal Corporation Ltd is rated 'Hold' by MarketsMOJO, with this rating last updated on 09 Mar 2026. However, the analysis and financial metrics discussed here reflect the company’s current position as of 25 July 2026, providing investors with an up-to-date view of its fundamentals, returns, and market performance.
Read full news article Announcements
Board Meeting Intimation for Intimation Of Board Meeting To Be Held On 03.08.2026.
23-Jul-2026 | Source : BSECoastal Corporation Ltdhas informed BSE that the meeting of the Board of Directors of the Company is scheduled on 03/08/2026 inter alia to consider and approve Intimation of Board Meeting to be held on 03.08.2026.
Compliances-Certificate under Reg. 74 (5) of SEBI (DP) Regulations 2018
07-Jul-2026 | Source : BSECertificate under Regulation 74(5) of SEBI (DP)Regulations2018 for the quarter ended 30th June 2026.
Closure of Trading Window
29-Jun-2026 | Source : BSEIntimation for Closure of Trading Window for the quarter ended 30.06.2026
Corporate Actions

(03 Aug 2026)

Coastal Corporation Ltd has declared 12% dividend, ex-date: 20 Sep 24

Coastal Corporation Ltd has announced 2:10 stock split, ex-date: 04 Mar 25

Coastal Corporation Ltd has announced 3:1 bonus issue, ex-date: 23 May 18

Coastal Corporation Ltd has announced 1:6 rights issue, ex-date: 25 Aug 22
Quality key factors
Valuation key factors
Technicals key factors
 Technical Indicator Scale: Bearish, Mildly Bearish, Sideways, Mildly Bullish, Bullish Turned
 Shareholding Snapshot : Jun 2026
Shareholding Compare (%holding)
Non Institution
None
Held by 0 Schemes
Held by 6 FIIs (1.05%)
Thottoli Valsaraj (12.17%)
Pinakin Chimanlal Shah (2.56%)
40.16%
Quarterly Results Snapshot (Consolidated) - Jun'26 - YoY

YoY Growth in quarter ended Jun 2026 is 38.23% vs 38.29% in Jun 2025

YoY Growth in quarter ended Jun 2026 is 100.87% vs 88.85% in Jun 2025
Half Yearly Results Snapshot (Consolidated) - Sep'25
Growth in half year ended Sep 2025 is 19.39% vs 35.69% in Sep 2024
Growth in half year ended Sep 2025 is 164.61% vs -54.18% in Sep 2024
Nine Monthly Results Snapshot (Consolidated) - Dec'25
YoY Growth in nine months ended Dec 2025 is 37.11% vs 47.72% in Dec 2024
YoY Growth in nine months ended Dec 2025 is 199.64% vs -48.55% in Dec 2024
Annual Results Snapshot (Consolidated) - Mar'26
YoY Growth in year ended Mar 2026 is 54.51% vs 44.23% in Mar 2025
YoY Growth in year ended Mar 2026 is 495.09% vs -0.88% in Mar 2025
About Coastal Corporation Ltd

Company Coordinates


