
Compare Genus Power with Similar Stocks
Dashboard
Strong ability to service debt as the company has a low Debt to EBITDA ratio of 2.52 times
Healthy long term growth as Net Sales has grown by an annual rate of 50.87% and Operating profit at 60.93%
With a growth in Net Sales of 36.96%, the company declared Very Positive results in Mar 26
With ROCE of 22.9, it has a Attractive valuation with a 3 Enterprise value to Capital Employed
Stock DNA
Other Electrical Equipment
INR 9,003 Cr (Small Cap)
16.00
54
0.00%
0.69
26.71%
4.38
Total Returns (Price + Dividend) 
Latest dividend: 0.6 per share ex-dividend date: Sep-23-2024
Risk Adjusted Returns v/s
Returns Beta

News

Genus Power Infrastructures Ltd Sees High-Value Trading Amid Price Pressure
Genus Power Infrastructures Ltd, a prominent player in the Other Electrical Equipment sector, witnessed one of the highest value turnovers on 30 June 2026, despite a significant price correction. The stock’s trading activity was marked by intense volume and institutional interest, reflecting a complex market sentiment amid a three-day losing streak.
Read full news article
Genus Power Infrastructures Ltd Sees Exceptional Volume Amid Price Decline
Genus Power Infrastructures Ltd, a small-cap player in the Other Electrical Equipment sector, witnessed extraordinary trading volumes on 30 June 2026 despite a sharp decline in its share price. The stock’s heavy turnover and price action signal significant market activity, raising questions about investor sentiment and potential accumulation or distribution patterns.
Read full news article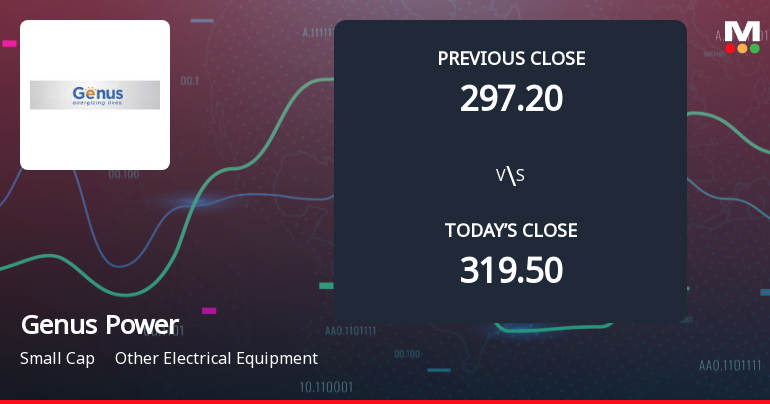
Announcements
Closure of Trading Window
25-Jun-2026 | Source : BSEClosure of Trading Window for the quarter ended June 30 2026.
Clarification To BSE E-Mail On Share Volume Movement
24-Jun-2026 | Source : BSEClarification to BSE on Share Volume Movement
Clarification sought from Genus Power Infrastructures Ltd
24-Jun-2026 | Source : BSEThe Exchange has sought clarification from Genus Power Infrastructures Ltd on June 24 2026 with reference to Movement in Volume.
The reply is awaited.
Corporate Actions

No Upcoming Board Meetings

Genus Power Infrastructures Ltd has declared 60% dividend, ex-date: 23 Sep 24

Genus Power Infrastructures Ltd has announced 1:10 stock split, ex-date: 22 Oct 10

No Bonus history available

No Rights history available
Quality key factors
Valuation key factors
Technicals key factors
 Technical Indicator Scale: Bearish, Mildly Bearish, Sideways, Mildly Bullish, Bullish Turned
 Shareholding Snapshot : Mar 2026
Shareholding Compare (%holding)
Promoters
69.4042
Held by 2 Schemes (2.92%)
Held by 94 FIIs (18.9%)
Hi - Print Electromack Private Limited (15.55%)
Chiswick Investment Pte Ltd (15.11%)
31.01%
Quarterly Results Snapshot (Consolidated) - Mar'26 - QoQ

QoQ Growth in quarter ended Mar 2026 is 36.96% vs -2.32% in Dec 2025
QoQ Growth in quarter ended Mar 2026 is 22.48% vs -1.91% in Dec 2025
Half Yearly Results Snapshot (Consolidated) - Sep'25
Growth in half year ended Sep 2025 is 132.11% vs 73.25% in Sep 2024
Growth in half year ended Sep 2025 is 113.30% vs 81.91% in Sep 2024
Nine Monthly Results Snapshot (Consolidated) - Dec'25
YoY Growth in nine months ended Dec 2025 is 113.51% vs 93.02% in Dec 2024

YoY Growth in nine months ended Dec 2025 is 123.61% vs 201.78% in Dec 2024
Annual Results Snapshot (Consolidated) - Mar'26
YoY Growth in year ended Mar 2026 is 94.55% vs 103.40% in Mar 2025
YoY Growth in year ended Mar 2026 is 90.22% vs 259.27% in Mar 2025
About Genus Power Infrastructures Ltd

Company Coordinates


