
Compare Sea TV Network with Similar Stocks
Dashboard
With a Negative Book Value, the company has a Weak Long Term Fundamental Strength
- Poor long term growth as Net Sales has grown by an annual rate of -8.28% and Operating profit at 0% over the last 5 years
- The company has a negative book value of Rs 40.24 crore
Flat results in Mar 26
Risky - Negative EBITDA
51.19% of Promoter Shares are Pledged
Below par performance in long term as well as near term
Stock DNA
Media & Entertainment
INR 4 Cr (Micro Cap)
7.00
21
0.00%
-0.83
-1.27%
-0.09
Total Returns (Price + Dividend) 
Sea TV Network for the last several years.
Risk Adjusted Returns v/s
Returns Beta

News


Sea TV Network Ltd Falls to 52-Week Low of Rs 3.04 as Sell-Off Deepens
For the second consecutive session, Sea TV Network Ltd has declined sharply, hitting a fresh 52-week low of Rs 3.04 on 18 Jun 2026. This latest drop extends the stock’s year-long underperformance, with a 43.28% loss compared to the Sensex’s modest 5.21% decline over the same period.
Read full news article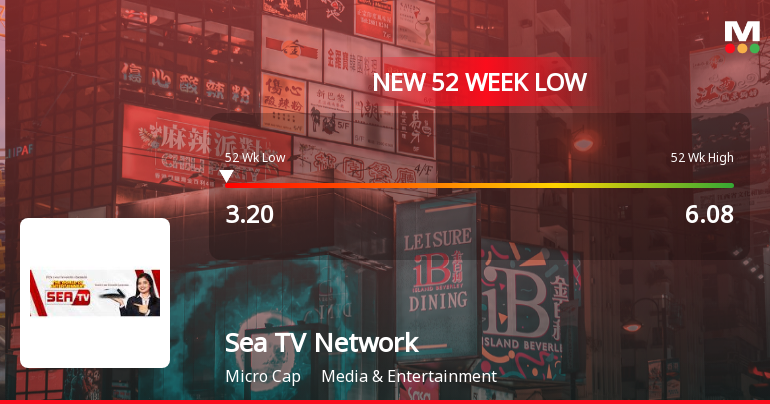
Sea TV Network Ltd Falls to 52-Week Low of Rs 3.2 as Sell-Off Deepens
For the second consecutive session, Sea TV Network Ltd has slipped further, hitting a fresh 52-week low of Rs 3.2 on 15 Jun 2026, marking a 3.03% decline on the day and extending its year-long slide to nearly 48%. This underperformance stands in stark contrast to the broader market rally, with the Sensex advancing 1.56% on the same day.
Read full news article Announcements
Submission Of Statement Of Deviation Or Variation In Public Issue Right Issue Preferential Issue Etc. For The Year Ended As On 31St March 2026
29-May-2026 | Source : BSEWe herein provide Statement of Deviation or Variation in Public Issue Right Issue Preferential Issue etc. pursuant to Regulation 32 of Securities and Exchange Board of India (Listing Obligations and Disclosure Requirements) Regulations 2015 for the purpose of making disclosure to the Stock Exchange. We request you to take the same on your records.
Compliances-Reg.24(A)-Annual Secretarial Compliance
28-May-2026 | Source : BSEPlease find enclosed herewith the Annual Secretarial Compliance Report for the financial year ended March 31 2026 issued by M/s Sonia Rani & Associates Practicing company secretary. Pursuant to regulation 24A of SEBI (Listing Obligations and Disclosure Requirements) Regulations 2015 read with SEBI circular No. CIR/CFD/CMD1/27//2019. You are requested to kindly take the same on your records.
Announcement under Regulation 30 (LODR)-Newspaper Publication
21-May-2026 | Source : BSEPursuant to the provisions of SEBI (Listing Obligations and Disclosure Requirements) Regulations 2015 please find enclosed herewith the copies of the Audited Standalone and Consolidated Financial Results of the Company for the quarter and Year ended as on 31st March 2026 published on the newspapers (Hindustan & Financial Express) which were approved at the Board Meeting of the Company held on Wednesday 20th May 2026 at 11:30 A.M. (IST) through Video Conferencing / Other Audio-Visual Means.
Corporate Actions

No Upcoming Board Meetings

No Dividend history available

No Splits history available

No Bonus history available

No Rights history available
Quality key factors
Valuation key factors
Technicals key factors
 Technical Indicator Scale: Bearish, Mildly Bearish, Sideways, Mildly Bullish, Bullish Turned
 Shareholding Snapshot : Mar 2026
Shareholding Compare (%holding)
Promoters
51.1915
Held by 0 Schemes
Held by 0 FIIs
Neeraj Jain (57.17%)
Amishaben Nitinkumar Shah (17.46%)
35.14%
Quarterly Results Snapshot (Consolidated) - Mar'26 - QoQ

QoQ Growth in quarter ended Mar 2026 is 34.78% vs 8.95% in Dec 2025
QoQ Growth in quarter ended Mar 2026 is 153.85% vs -163.41% in Dec 2025
Half Yearly Results Snapshot (Consolidated) - Sep'25

Growth in half year ended Sep 2025 is -44.17% vs 11.17% in Sep 2024
Growth in half year ended Sep 2025 is 1,500.00% vs 101.28% in Sep 2024
Nine Monthly Results Snapshot (Consolidated) - Dec'25
YoY Growth in nine months ended Dec 2025 is -27.06% vs -10.79% in Dec 2024
YoY Growth in nine months ended Dec 2025 is 136.19% vs -103.45% in Dec 2024
Annual Results Snapshot (Consolidated) - Mar'26
YoY Growth in year ended Mar 2026 is -25.09% vs -3.52% in Mar 2025
YoY Growth in year ended Mar 2026 is 169.33% vs -102.47% in Mar 2025
About Sea TV Network Ltd

Company Coordinates


