
Compare India Gelatine with Similar Stocks
Dashboard
The company is Net-Debt Free
- PAT(Q) At Rs 4.48 cr has Fallen at -31.9% (vs previous 4Q average)
- NET SALES(Q) Lowest at Rs 38.98 cr
- PBDIT(Q) Lowest at Rs 5.00 cr.
With ROE of 13, it has a Fair valuation with a 1.3 Price to Book Value
Majority shareholders : Promoters
Consistent Underperformance against the benchmark over the last 3 years
Stock DNA
Specialty Chemicals
INR 255 Cr (Micro Cap)
10.00
45
1.39%
-0.33
12.97%
1.32
Total Returns (Price + Dividend) 
Latest dividend: 5 per share ex-dividend date: Sep-16-2025
Risk Adjusted Returns v/s
Returns Beta

News
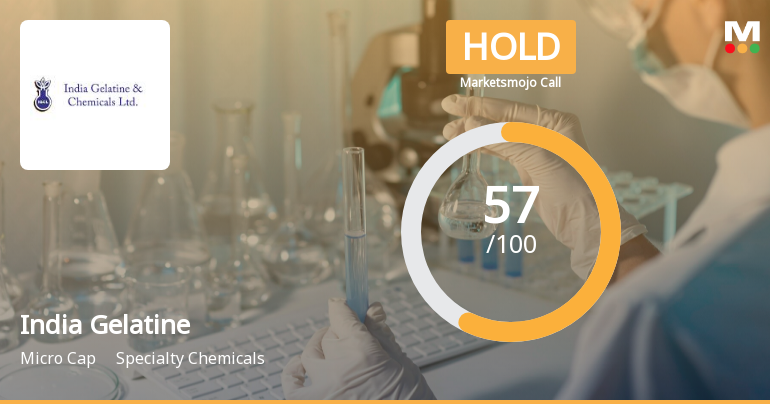
India Gelatine & Chemicals Ltd is Rated Hold
India Gelatine & Chemicals Ltd is rated 'Hold' by MarketsMOJO, with this rating last updated on 21 May 2026. However, the analysis and financial metrics presented here reflect the company’s current position as of 22 June 2026, providing investors with the most recent and relevant data to assess the stock’s outlook.
Read full news article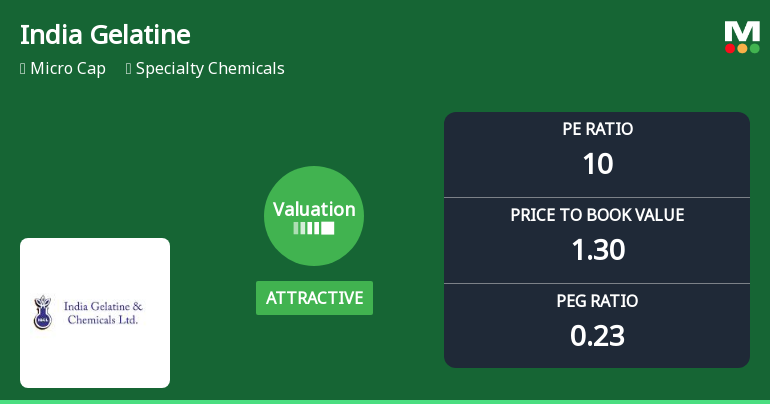
India Gelatine & Chemicals Ltd Valuation Shifts Signal Renewed Price Attractiveness
India Gelatine & Chemicals Ltd has seen a notable shift in its valuation parameters, moving from a fair to an attractive rating, driven by its compelling price-to-earnings (P/E) and price-to-book value (P/BV) ratios. This repositioning contrasts sharply with its specialty chemicals sector peers, many of whom trade at significantly higher multiples, underscoring India Gelatine’s growing appeal for value-conscious investors.
Read full news article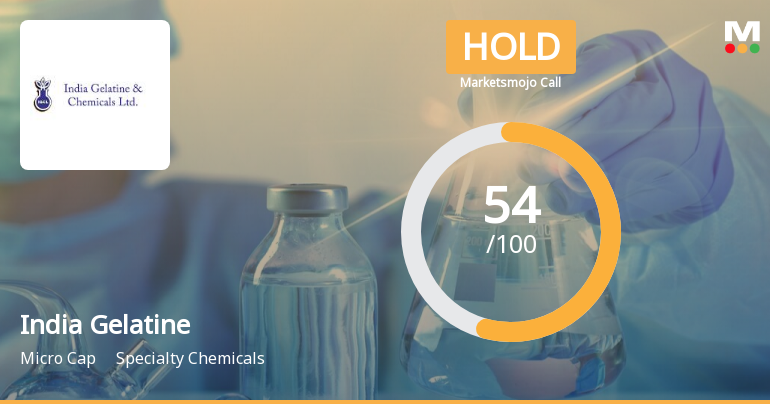
India Gelatine & Chemicals Ltd is Rated Hold
India Gelatine & Chemicals Ltd is rated 'Hold' by MarketsMOJO, with this rating last updated on 21 May 2026. However, the analysis and financial metrics discussed here reflect the stock's current position as of 11 June 2026, providing investors with an up-to-date view of the company’s fundamentals, returns, and market standing.
Read full news article Announcements
Compliances-Reg.24(A)-Annual Secretarial Compliance
26-May-2026 | Source : BSEAnnual Secretarial Compliance Report for the financial year ended March 31 2026 is enclosed herewith.
Announcement under Regulation 30 (LODR)-Newspaper Publication
22-May-2026 | Source : BSEIntimation of Newspaper publication of extract of the Audited Financial results of the company for the quarter & year ended as on 31st March 2026.
Board Meeting Outcome for Outcome Of Board Meeting Held On 21St May 2026
21-May-2026 | Source : BSEThe outcome of the Board Meeting held on 21st May 2026 is enclose.
Corporate Actions

No Upcoming Board Meetings

India Gelatine & Chemicals Ltd has declared 50% dividend, ex-date: 16 Sep 25

No Splits history available

No Bonus history available

No Rights history available
Quality key factors
Valuation key factors
Technicals key factors
 Technical Indicator Scale: Bearish, Mildly Bearish, Sideways, Mildly Bullish, Bullish Turned
 Shareholding Snapshot : Mar 2026
Shareholding Compare (%holding)
Promoters
None
Held by 0 Schemes
Held by 0 FIIs
Ashok Matches And Timber Industries Private Limited (27.28%)
Sangeetha S (2.81%)
26.4%
Quarterly Results Snapshot (Standalone) - Mar'26 - QoQ

QoQ Growth in quarter ended Mar 2026 is -13.05% vs -4.41% in Dec 2025
QoQ Growth in quarter ended Mar 2026 is -36.90% vs 10.25% in Dec 2025
Half Yearly Results Snapshot (Standalone) - Sep'25

Growth in half year ended Sep 2025 is -7.34% vs -13.07% in Sep 2024
Growth in half year ended Sep 2025 is 66.30% vs -47.75% in Sep 2024
Nine Monthly Results Snapshot (Standalone) - Dec'25
YoY Growth in nine months ended Dec 2025 is -10.00% vs -5.98% in Dec 2024
YoY Growth in nine months ended Dec 2025 is 76.39% vs -49.98% in Dec 2024
Annual Results Snapshot (Standalone) - Mar'26
YoY Growth in year ended Mar 2026 is -14.47% vs -3.55% in Mar 2025
YoY Growth in year ended Mar 2026 is 44.34% vs -38.75% in Mar 2025
About India Gelatine & Chemicals Ltd

Company Coordinates


