
Compare HB Portfolio with Similar Stocks
Dashboard
With a Operating Losses, the company has a Weak Long Term Fundamental Strength
- Poor long term growth as Operating profit has grown by an annual rate of -16.12%
Flat results in Mar 26
With ROE of 0.1, it has a Very Expensive valuation with a 0.3 Price to Book Value
Underperformed the market in the last 1 year
Stock DNA
Non Banking Financial Company (NBFC)
INR 65 Cr (Micro Cap)
239.00
85
1.67%
0.01
0.10%
0.25
Total Returns (Price + Dividend) 
Latest dividend: 1 per share ex-dividend date: Nov-17-2025
Risk Adjusted Returns v/s
Returns Beta

News

HB Portfolio Ltd is Rated Strong Sell
HB Portfolio Ltd is rated Strong Sell by MarketsMOJO. This rating was last updated on 27 Feb 2025, but the analysis below reflects the stock’s current position as of 29 June 2026, incorporating the latest fundamentals, returns, and financial metrics.
Read full news article
HB Portfolio Ltd is Rated Strong Sell
HB Portfolio Ltd is rated Strong Sell by MarketsMOJO, with this rating last updated on 27 Feb 2025. However, the analysis and financial metrics discussed here reflect the company’s current position as of 17 June 2026, providing investors with an up-to-date perspective on the stock’s fundamentals, valuation, financial trends, and technical outlook.
Read full news article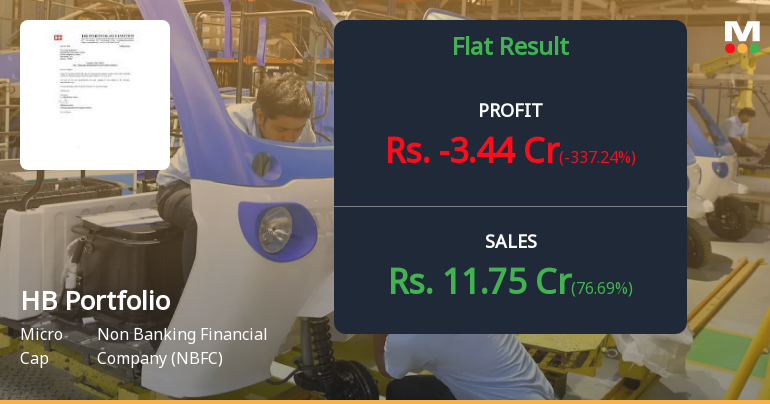
HB Portfolio Q4 FY26: Steep Loss Overshadows Revenue Surge
HB Portfolio Ltd, a micro-cap non-banking financial company with a market capitalisation of ₹67.00 crores, reported a consolidated net loss of ₹3.44 crores in Q4 FY26 (Mar'26), a sharp reversal from the ₹1.45 crores profit posted in Q3 FY26 (Dec'25). Despite a robust 76.69% quarter-on-quarter revenue jump to ₹11.75 crores, the company's profitability collapsed as operating margins turned deeply negative at -29.62%, raising serious concerns about the sustainability of its business model.
Read full news article Announcements
Closure of Trading Window
26-Jun-2026 | Source : BSEPursuant to the provisions of SEBI (Prohibition of Insider Trading) Regulations 2015 the trading window for dealing in equity shares of HB Portfolio Limited shall remain closed for designated persons and/ or their immediate relatives w.e.f. 01st July 2026 until 48 hours after the declaration of Un-audited Financial Results of the Company (Standalone & Consolidated) for the first quarter ending on 30th June 2026.
Announcement under Regulation 30 (LODR)-Newspaper Publication
24-Jun-2026 | Source : BSENewspaper Publication regarding Special Window for re-lodgement of transfer requests and dematerialisation of physical securities
Announcement under Regulation 30 (LODR)-Newspaper Publication
30-May-2026 | Source : BSECopy of Newspaper publication of the extract of Financial Results (Standalone & Consolidated) for the last quarter and Financial Year ended 31st March 2026
Corporate Actions

No Upcoming Board Meetings

HB Portfolio Ltd has declared 10% dividend, ex-date: 17 Nov 25

No Splits history available

No Bonus history available

No Rights history available
Quality key factors
Valuation key factors
Technicals key factors
 Technical Indicator Scale: Bearish, Mildly Bearish, Sideways, Mildly Bullish, Bullish Turned
 Shareholding Snapshot : Mar 2026
Shareholding Compare (%holding)
Promoters
None
Held by 8 Schemes (0.01%)
Held by 0 FIIs
Lalit Bhasin (58.76%)
Ashari Agencies Ltd (1.15%)
25.62%
Quarterly Results Snapshot (Consolidated) - Mar'26 - QoQ

QoQ Growth in quarter ended Mar 2026 is 76.69% vs 69.21% in Dec 2025

QoQ Growth in quarter ended Mar 2026 is -337.24% vs 1,712.50% in Dec 2025
Half Yearly Results Snapshot (Consolidated) - Sep'25
Growth in half year ended Sep 2025 is -15.79% vs 28.70% in Sep 2024
Growth in half year ended Sep 2025 is -41.60% vs 10.89% in Sep 2024
Nine Monthly Results Snapshot (Consolidated) - Dec'25
YoY Growth in nine months ended Dec 2025 is -22.34% vs 40.87% in Dec 2024
YoY Growth in nine months ended Dec 2025 is 23.26% vs -45.37% in Dec 2024
Annual Results Snapshot (Consolidated) - Mar'26
YoY Growth in year ended Mar 2026 is -3.74% vs -48.46% in Mar 2025
YoY Growth in year ended Mar 2026 is 640.00% vs -100.71% in Mar 2025
About HB Portfolio Ltd

Company Coordinates


