
Compare Crane Infra with Similar Stocks
Dashboard
Weak Long Term Fundamental Strength with an average Return on Equity (ROE) of 2.29%
- Poor long term growth as Net Sales has grown by an annual rate of 13.82% and Operating profit at 7.26% over the last 5 years
- Company's ability to service its debt is weak with a poor EBIT to Interest (avg) ratio of 0.85
Flat results in Mar 26
With ROE of 1.5, it has a Very Expensive valuation with a 0.3 Price to Book Value
Below par performance in long term as well as near term
Total Returns (Price + Dividend) 
Crane Infra for the last several years.
Risk Adjusted Returns v/s
Returns Beta

News
Are Crane Infrastructure Ltd latest results good or bad?
Crane Infrastructure Ltd's latest financial results for Q4 FY26 indicate a challenging operational environment. The company reported a net profit of ₹0.12 crore, which reflects a significant decline of 29.41% compared to the previous quarter. Revenue remained stagnant at ₹0.35 crore for the seventh consecutive quarter, indicating a lack of growth momentum in its operations. This prolonged revenue flatline raises concerns about the company’s ability to generate new business or effectively manage its existing projects. The operating margin for the quarter contracted to 57.14%, down from 68.57% in the prior quarter, signaling a decline in operational efficiency. Additionally, the profit after tax (PAT) margin also saw a compression to 34.29% from 48.57%, further highlighting the challenges in maintaining profitability. The company's return on equity (ROE) stands at a low 1.89%, suggesting inefficiencies in ca...
Read full news articleAre Crane Infrastructure Ltd latest results good or bad?
Crane Infrastructure Ltd's latest financial results reveal a company grappling with operational challenges and inconsistent performance. In the most recent quarter, the company reported net sales of ₹0.35 crores, which has remained unchanged for five consecutive quarters, indicating a lack of revenue growth. Despite this stagnation, net profit showed a notable increase to ₹0.17 crores, up from ₹0.05 crores in the previous quarter, primarily driven by margin expansion rather than top-line growth. The operating profit margin improved significantly to 68.57%, reflecting enhanced cost management, while the PAT margin also increased to 48.57%. However, these improvements raise concerns about the sustainability of such profitability, especially given the volatility in earnings and the company's average return on equity of just 2.32%. This low ROE suggests that the company is struggling to generate adequate retur...
Read full news article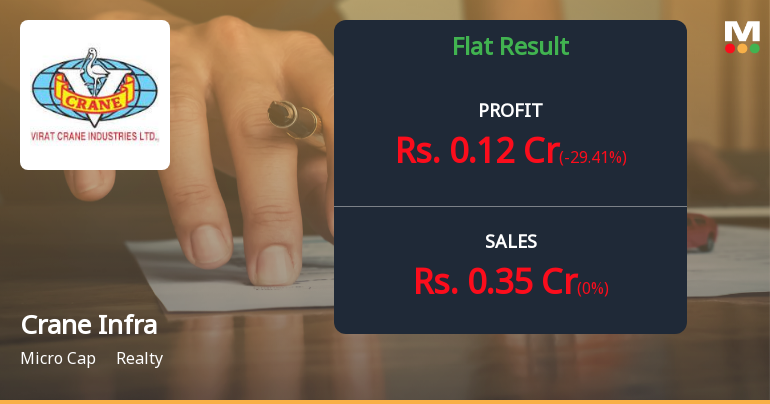
Crane Infrastructure Q4 FY26: Stagnant Revenue and Margin Erosion Signal Deeper Troubles
Crane Infrastructure Limited, a micro-cap real estate company with a market capitalisation of ₹11.00 crores, reported troubling Q4 FY26 results that underscore the company's inability to generate meaningful growth. Net profit for the quarter stood at ₹0.12 crores, declining 29.41% quarter-on-quarter from ₹0.17 crores in Q3 FY26, whilst remaining flat year-on-year. The stock has plummeted 34.72% over the past year, significantly underperforming both the Sensex (-8.40%) and the broader realty sector (-13.65%), currently trading at ₹13.16 after a sharp 6.80% decline on May 29, 2026.
Read full news article Announcements
Compliances-Certificate under Reg. 74 (5) of SEBI (DP) Regulations 2018
13-Jul-2026 | Source : BSESubmission of certificate under Reg 74(5) of SEBI (DP) Reg2018 for the 1st quarter ended on 30-06-2026 for the F.Y 2026-27
Closure of Trading Window
27-Jun-2026 | Source : BSEIntimation of Closure of trading Window period for the 1st quarter period will be ended on 30th June 2026 for the F.Y 2026-27
Compliances-Reg.24(A)-Annual Secretarial Compliance
29-May-2026 | Source : BSESubmission of Annual Secretarial Compliance for the F.Y 2025-26
Corporate Actions

No Upcoming Board Meetings

No Dividend history available

No Splits history available

No Bonus history available

No Rights history available
Quality key factors
Valuation key factors
Technicals key factors
 Technical Indicator Scale: Bearish, Mildly Bearish, Sideways, Mildly Bullish, Bullish Turned
 Shareholding Snapshot : Mar 2026
Shareholding Compare (%holding)
Non Institution
None
Held by 1 Schemes (0.07%)
Held by 0 FIIs
Grandhi Venkata Satya Lakshmi Kantha Rao (22.71%)
None
47.16%
Quarterly Results Snapshot (Standalone) - Mar'26 - QoQ
QoQ Growth in quarter ended Mar 2026 is 0.00% vs 0.00% in Dec 2025

QoQ Growth in quarter ended Mar 2026 is -29.41% vs 240.00% in Dec 2025
Half Yearly Results Snapshot (Standalone) - Sep'25

Growth in half year ended Sep 2025 is 5.97% vs -75.72% in Sep 2024
Growth in half year ended Sep 2025 is -55.26% vs -61.22% in Sep 2024
Nine Monthly Results Snapshot (Standalone) - Dec'25
YoY Growth in nine months ended Dec 2025 is 3.92% vs -66.23% in Dec 2024
YoY Growth in nine months ended Dec 2025 is -20.93% vs -61.26% in Dec 2024
Annual Results Snapshot (Standalone) - Mar'26
YoY Growth in year ended Mar 2026 is 2.92% vs -61.19% in Mar 2025
YoY Growth in year ended Mar 2026 is -30.30% vs -54.48% in Mar 2025
About Crane Infrastructure Ltd

Company Coordinates


