
Compare Jindal Poly Film with Similar Stocks
Dashboard
Poor long term growth as Net Sales has grown by an annual rate of -3.97% and Operating profit at -173.00% over the last 5 years
The company has declared negative results for the last 3 consecutive quarters
Risky - Negative Operating Profits
Falling Participation by Institutional Investors
Stock DNA
Packaging
INR 2,870 Cr (Small Cap)
NA (Loss Making)
36
0.88%
-0.01
-1.52%
0.72
Total Returns (Price + Dividend) 
Latest dividend: 5.90198252688172 per share ex-dividend date: Sep-23-2025
Risk Adjusted Returns v/s
Returns Beta

News

Jindal Poly Films Ltd is Rated Sell
Jindal Poly Films Ltd is rated Sell by MarketsMOJO, with this rating last updated on 23 March 2026. However, the analysis and financial metrics discussed here reflect the stock's current position as of 20 June 2026, providing investors with an up-to-date view of the company’s fundamentals, returns, and market standing.
Read full news article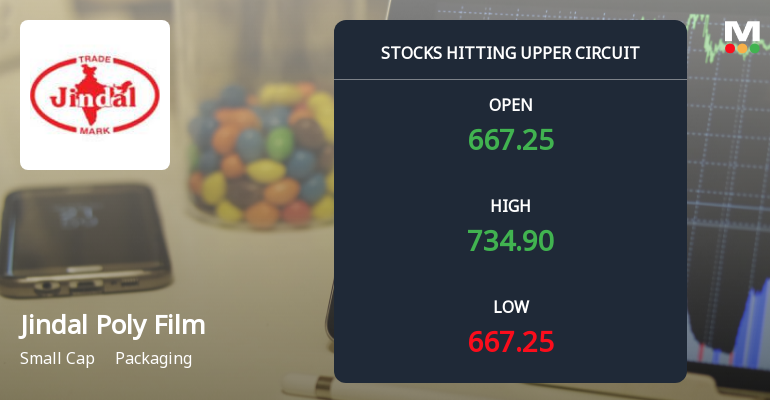
Jindal Poly Films Ltd Locks at Upper Circuit With 3.31% Gain — Buyers Queue, Sellers Absent
At Rs 735.40, the buying was done — not because demand dried up, but because the exchange wouldn't let the stock go any higher. Jindal Poly Films Ltd locked at its upper circuit of 5% on 11 Jun 2026, with buyers queuing and no sellers willing to part with shares.
Read full news article
Jindal Poly Films Ltd Locks at Upper Circuit With 4.19% Gain — Buyers Queue, Sellers Absent
At Rs 703.35, the buying was done — not because demand dried up, but because the exchange wouldn't let the stock go any higher. Jindal Poly Films Ltd locked at its upper circuit of 4.19% on 10 Jun 2026, with buyers queuing and no sellers willing to part with shares.
Read full news article Announcements
Disclosure Under Regulation 30 Of SEBI (Listing Obligations And Disclosure Requirements) Regulations 2015
09-Jun-2026 | Source : BSEAppeal before Honble Supreme Court of India
Disclosure Under Regulation 30
06-Jun-2026 | Source : BSEAppeal before Honble Supreme Court of India
Compliances-Reg.24(A)-Annual Secretarial Compliance
30-May-2026 | Source : BSEAnnual Secretarial Compliance report
Corporate Actions

No Upcoming Board Meetings

Jindal Poly Films Ltd has declared 59% dividend, ex-date: 23 Sep 25

No Splits history available

Jindal Poly Films Ltd has announced 1:1 bonus issue, ex-date: 22 Oct 10

No Rights history available
Quality key factors
Valuation key factors
Technicals key factors
 Technical Indicator Scale: Bearish, Mildly Bearish, Sideways, Mildly Bullish, Bullish Turned
 Shareholding Snapshot : Mar 2026
Shareholding Compare (%holding)
Promoters
None
Held by 2 Schemes (0.0%)
Held by 25 FIIs (2.55%)
Concatenate Flexi Films Advest Private Limited (62.8%)
Monet Securities Private Ltd (8.99%)
9.51%
Quarterly Results Snapshot (Consolidated) - Dec'25 - QoQ

QoQ Growth in quarter ended Dec 2025 is -9.44% vs -55.08% in Sep 2025

QoQ Growth in quarter ended Dec 2025 is -653.79% vs -134.69% in Sep 2025
Half Yearly Results Snapshot (Consolidated) - Sep'25
Growth in half year ended Sep 2025 is -47.96% vs 36.39% in Sep 2024
Growth in half year ended Sep 2025 is -91.54% vs 159.26% in Sep 2024
Nine Monthly Results Snapshot (Consolidated) - Dec'25
YoY Growth in nine months ended Dec 2025 is -54.54% vs 30.92% in Dec 2024
YoY Growth in nine months ended Dec 2025 is -125.05% vs 219.54% in Dec 2024
Annual Results Snapshot (Consolidated) - Mar'25
YoY Growth in year ended Mar 2025 is 18.84% vs -16.42% in Mar 2024
YoY Growth in year ended Mar 2025 is 53.55% vs -77.59% in Mar 2024
About Jindal Poly Films Ltd

Company Coordinates


