
Compare Ducon Tech with Similar Stocks
Dashboard
Weak Long Term Fundamental Strength with an average Return on Capital Employed (ROCE) of 9.62%
- Poor long term growth as Net Sales has grown by an annual rate of 4.27% and Operating profit at 14.38% over the last 5 years
- Low ability to service debt as the company has a high Debt to EBITDA ratio of 3.94 times
Negative results in Mar 26
Consistent Underperformance against the benchmark over the last 3 years
Stock DNA
Industrial Manufacturing
INR 112 Cr (Micro Cap)
10.00
23
0.00%
0.40
6.61%
0.68
Total Returns (Price + Dividend) 
Ducon Tech for the last several years.
Risk Adjusted Returns v/s
Returns Beta

News
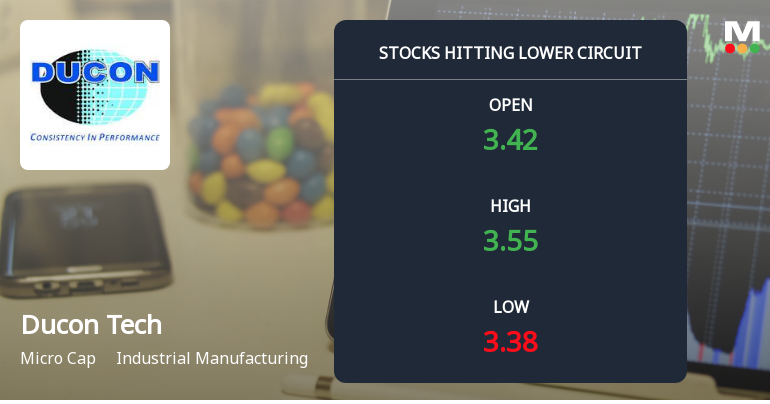
Ducon Infratechnologies Ltd Locks at Lower Circuit With 4.84% Loss — Sellers Queue, No Buyers in Sight
At Rs 3.34, sellers were still queuing — but there were no buyers willing to take the other side. Ducon Infratechnologies Ltd locked at its lower circuit of 4.84% on 23 Jun 2026, with unfilled sell orders and a frozen price, reflecting persistent selling pressure in a micro-cap stock with limited liquidity.
Read full news article
Ducon Infratechnologies Ltd Locks at Upper Circuit With 5% Gain — Buyers Queue, Sellers Absent
At Rs 3.79, the buying was done — not because demand dried up, but because the exchange wouldn't let the stock go any higher. Ducon Infratechnologies Ltd locked at its upper circuit of 5% on 16 Jun 2026, with buyers queuing and no sellers willing to part with shares.
Read full news article
Ducon Infratechnologies Ltd is Rated Strong Sell
Ducon Infratechnologies Ltd is rated Strong Sell by MarketsMOJO. This rating was last updated on 13 February 2026, reflecting a reassessment of the stock’s outlook. However, all fundamentals, returns, and financial metrics discussed here are based on the company’s current position as of 16 June 2026, providing investors with the most up-to-date analysis.
Read full news article Announcements
Announcement under Regulation 30 (LODR)-Press Release / Media Release
15-Jun-2026 | Source : BSEPress release as attached
Submission Of Draft Letter Of Offer For The Proposed Rights Issue Of Ducon Infratechnologies Limited
13-Jun-2026 | Source : BSESubmission of Draft Letter of Offer for the Proposed Rights issue.
Board Meeting Outcome for Outcome Of The Meeting Of The Board Of Directors Held On Friday 12Th June 2026
12-Jun-2026 | Source : BSEWe hereby inform you that the Board of Directors of the Company at its meeting held today i.e. Friday 12th June 2026 through Video Conferencing (VC)/Other Audio-Visual Means (OAVM) inter alia considered and approved the agenda mentioned in the Outcome attached herewith.
Corporate Actions

No Upcoming Board Meetings

No Dividend history available

No Splits history available

Ducon Infratechnologies Ltd has announced 1:10 bonus issue, ex-date: 18 Apr 22

Ducon Infratechnologies Ltd has announced 1:4 rights issue, ex-date: 30 Aug 24
Quality key factors
Valuation key factors
Technicals key factors
 Technical Indicator Scale: Bearish, Mildly Bearish, Sideways, Mildly Bullish, Bullish Turned
 Shareholding Snapshot : Mar 2026
Shareholding Compare (%holding)
Non Institution
None
Held by 0 Schemes
Held by 0 FIIs
Arun Govil (38.08%)
Sandeep Padmakant Parikh (1.39%)
54.8%
Quarterly Results Snapshot (Consolidated) - Mar'26 - QoQ

QoQ Growth in quarter ended Mar 2026 is 6.96% vs -17.26% in Dec 2025
QoQ Growth in quarter ended Mar 2026 is -19.91% vs -37.40% in Dec 2025
Half Yearly Results Snapshot (Consolidated) - Sep'25

Growth in half year ended Sep 2025 is 2.93% vs 10.14% in Sep 2024
Growth in half year ended Sep 2025 is 4.44% vs 363.12% in Sep 2024
Nine Monthly Results Snapshot (Consolidated) - Dec'25
YoY Growth in nine months ended Dec 2025 is -3.58% vs 6.62% in Dec 2024
YoY Growth in nine months ended Dec 2025 is -8.15% vs 119.91% in Dec 2024
Annual Results Snapshot (Consolidated) - Mar'26
YoY Growth in year ended Mar 2026 is -6.71% vs 7.84% in Mar 2025
YoY Growth in year ended Mar 2026 is -18.97% vs 77.59% in Mar 2025
About Ducon Infratechnologies Ltd

Company Coordinates


