
Compare B.C. Power with Similar Stocks
Dashboard
With a Operating Losses, the company has a Weak Long Term Fundamental Strength
- Company's ability to service its debt is weak with a poor EBIT to Interest (avg) ratio of -1.08
- The company has been able to generate a Return on Equity (avg) of 2.46% signifying low profitability per unit of shareholders funds
- PAT(Q) At Rs -1.39 cr has Fallen at -308.8%
- PBDIT(Q) Lowest at Rs -2.42 cr.
- PBT LESS OI(Q) Lowest at Rs -2.51 cr.
Risky - Negative EBITDA
Consistent Underperformance against the benchmark over the last 3 years
Stock DNA
Cables - Electricals
INR 14 Cr (Micro Cap)
30.00
50
0.00%
-0.11
1.73%
0.32
Total Returns (Price + Dividend) 
B.C. Power for the last several years.
Risk Adjusted Returns v/s
Returns Beta

News

B.C. Power Controls Ltd Forms Golden Cross Amid Mixed Technical Signals
The 50-day moving average for B.C. Power Controls Ltd has crossed above the 200-day moving average, signalling a golden cross on 9 Jun 2026. Yet, the broader technical and fundamental picture presents a nuanced view that tempers the enthusiasm typically associated with this event.
Read full news article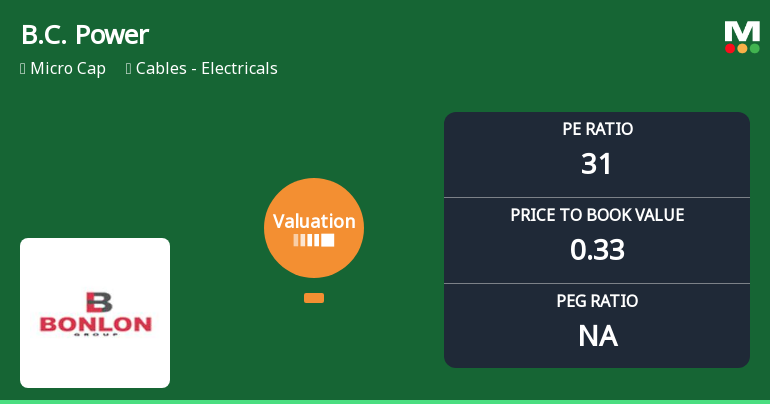
B.C. Power Controls Ltd: Valuation Shifts Signal Heightened Risk Amid Weak Returns
B.C. Power Controls Ltd, a micro-cap player in the Cables - Electricals sector, has seen a marked deterioration in its valuation parameters, shifting from very attractive to risky territory. Despite a modest market price of ₹1.99, the company’s elevated price-to-earnings ratio and concerning financial metrics have prompted a downgrade in its Mojo Grade to Strong Sell, reflecting heightened investor caution.
Read full news article
B.C. Power Controls Ltd Reports Sharp Quarterly Decline Amid Negative Financial Trend
B.C. Power Controls Ltd, a micro-cap player in the Cables - Electricals sector, has witnessed a marked deterioration in its financial performance for the quarter ended March 2026. Despite some growth in net sales and debtor efficiency, the company’s profitability metrics have plunged sharply, prompting a downgrade to a Strong Sell rating by MarketsMOJO as of 19 January 2026.
Read full news article Announcements
Announcement under Regulation 30 (LODR)-Newspaper Publication
28-May-2026 | Source : BSEThe Company has submitted the newspaper publication regarding financial results of quarter and year ended 31st March 2026.
AUDITED FINANCIAL RESULTS FOR THE QUARTER AND YEAR ENDED 31.03.2026
27-May-2026 | Source : BSEThe Company has submitted the audited standalone financial results for the quarter and year ended March 31 2026
Board Meeting Outcome for OUTCOME OF BOARD MEETING
27-May-2026 | Source : BSEThe Company has submitted the outcome of Board Meeting held today.
Corporate Actions

No Upcoming Board Meetings

No Dividend history available

B.C. Power Controls Ltd has announced 2:10 stock split, ex-date: 14 Jun 18

No Bonus history available

No Rights history available
Quality key factors
Valuation key factors
Technicals key factors
 Technical Indicator Scale: Bearish, Mildly Bearish, Sideways, Mildly Bullish, Bullish Turned
 Shareholding Snapshot : Mar 2026
Shareholding Compare (%holding)
Non Institution
None
Held by 0 Schemes
Held by 1 FIIs (0.0%)
None
Nitin Aggarwal (6.03%)
88.66%
Quarterly Results Snapshot (Standalone) - Mar'26 - YoY

YoY Growth in quarter ended Mar 2026 is -88.50% vs 39.56% in Mar 2025
YoY Growth in quarter ended Mar 2026 is -308.82% vs 64.58% in Mar 2025
Half Yearly Results Snapshot (Standalone) - Sep'25
Growth in half year ended Sep 2025 is -12.92% vs -10.10% in Sep 2024

Growth in half year ended Sep 2025 is 69.33% vs -72.63% in Sep 2024
Nine Monthly Results Snapshot (Standalone) - Dec'25
YoY Growth in nine months ended Dec 2025 is 24.36% vs -5.71% in Dec 2024
YoY Growth in nine months ended Dec 2025 is 87.61% vs -32.34% in Dec 2024
Annual Results Snapshot (Standalone) - Mar'26
YoY Growth in year ended Mar 2026 is 1.30% vs 0.98% in Mar 2025
YoY Growth in year ended Mar 2026 is -7.59% vs 9.72% in Mar 2025
About B.C. Power Controls Ltd

Company Coordinates


