
Compare Nexome Cap. Mkt. with Similar Stocks
Dashboard
Weak Long Term Fundamental Strength with an average Return on Equity (ROE) of 2.42%
- Poor long term growth as Net Sales has grown by an annual rate of -6.89%
With a growth in Net Sales of 1856.25%, the company declared Outstanding results in Mar 26
With ROE of 7.1, it has a Attractive valuation with a 0.7 Price to Book Value
Consistent Returns over the last 3 years
Stock DNA
Non Banking Financial Company (NBFC)
INR 126 Cr (Micro Cap)
11.00
21
0.00%
0.04
7.06%
0.71
Total Returns (Price + Dividend) 
Latest dividend: 1 per share ex-dividend date: Sep-12-2018
Risk Adjusted Returns v/s
Returns Beta

News
Nexome Capital Markets Ltd is Rated Hold
Nexome Capital Markets Ltd is rated 'Hold' by MarketsMOJO, with this rating last updated on 29 May 2026. However, the analysis and financial metrics discussed here reflect the stock's current position as of 16 June 2026, providing investors with an up-to-date view of the company’s fundamentals, valuation, financial trends, and technical outlook.
Read full news article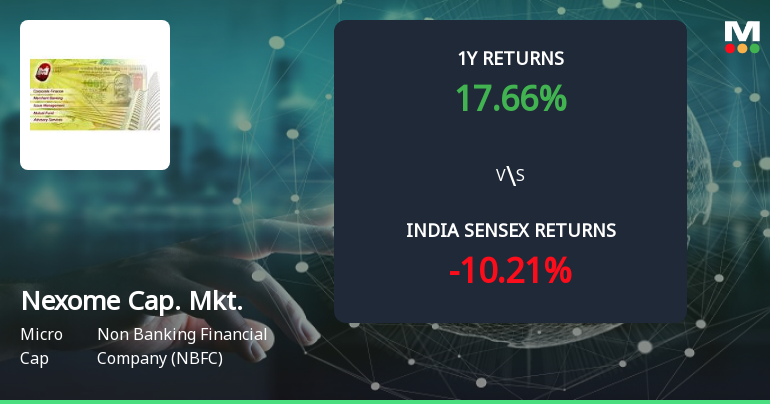
Golden Cross Forms in Nexome Capital Markets Ltd — On a Day the Stock Fell 4.7%. What the Mixed Signals Mean
The 50-day moving average has crossed above the 200-day moving average for Nexome Capital Markets Ltd, signalling a golden cross on 10 Jun 2026. Yet, the stock declined 4.72% on the same day, while monthly momentum indicators remain mildly bearish. This juxtaposition of signals calls for a detailed examination of whether the golden cross is a reliable indicator or an isolated technical event.
Read full news article
Nexome Capital Markets Ltd Upgraded to Hold on Strong Financial and Valuation Improvements
Nexome Capital Markets Ltd, a micro-cap player in the Non Banking Financial Company (NBFC) sector, has seen its investment rating upgraded from Sell to Hold as of 29 May 2026. This change reflects significant improvements across financial performance, valuation attractiveness, and technical indicators, signalling a turnaround in the company’s prospects after a period of underperformance.
Read full news article Announcements
Announcement under Regulation 30 (LODR)-Newspaper Publication
26-May-2026 | Source : BSENewspaper Publication of Financial Results for the quarter and year ended 31.03.2026
Announcement Under Regulation 30 - Outcome Of Board Meeting Dated 25.05.2026
25-May-2026 | Source : BSEAnnouncement under Regulation 30 - Outcome of Board Meeting dated 25.05.2026
Corporate Action-Board approves Dividend
25-May-2026 | Source : BSEBoard approves Dividend
Corporate Actions

No Upcoming Board Meetings

Nexome Capital Markets Ltd has declared 15% dividend, ex-date: 31 Jul 26

No Splits history available

No Bonus history available

Nexome Capital Markets Ltd has announced 1:2 rights issue, ex-date: 05 Mar 26
Quality key factors
Valuation key factors
Technicals key factors
 Technical Indicator Scale: Bearish, Mildly Bearish, Sideways, Mildly Bullish, Bullish Turned
 Shareholding Snapshot : Apr 2026
Shareholding Compare (%holding)
Promoters
None
Held by 0 Schemes
Held by 0 FIIs
Progressive Star Finance Private Limited (20.88%)
Merlin Resources Private Limited (7.74%)
16.69%
Quarterly Results Snapshot (Consolidated) - Mar'26 - QoQ

QoQ Growth in quarter ended Mar 2026 is 1,856.25% vs -86.54% in Dec 2025
QoQ Growth in quarter ended Mar 2026 is 1,045.00% vs -200.00% in Dec 2025
Half Yearly Results Snapshot (Consolidated) - Sep'25

Growth in half year ended Sep 2025 is 12.91% vs 47.44% in Sep 2024
Growth in half year ended Sep 2025 is 272.13% vs 221.05% in Sep 2024
Nine Monthly Results Snapshot (Consolidated) - Dec'25
YoY Growth in nine months ended Dec 2025 is -11.51% vs -86.99% in Dec 2024
YoY Growth in nine months ended Dec 2025 is 47.67% vs -50.86% in Dec 2024
Annual Results Snapshot (Consolidated) - Mar'26
YoY Growth in year ended Mar 2026 is 21.95% vs -83.17% in Mar 2025
YoY Growth in year ended Mar 2026 is 815.38% vs -51.45% in Mar 2025
About Nexome Capital Markets Ltd

Company Coordinates


