
Compare Sambhaav Media with Similar Stocks
Dashboard
Weak Long Term Fundamental Strength with an average Return on Capital Employed (ROCE) of 0.34%
- Poor long term growth as Net Sales has grown by an annual rate of 0.49% over the last 5 years
- Company's ability to service its debt is weak with a poor EBIT to Interest (avg) ratio of 0.06
Flat results in Mar 26
With ROE of 0.3, it has a Very Expensive valuation with a 1.6 Price to Book Value
Stock DNA
Media & Entertainment
INR 134 Cr (Micro Cap)
540.00
12
0.00%
-0.01
0.29%
1.63
Total Returns (Price + Dividend) 
Sambhaav Media for the last several years.
Risk Adjusted Returns v/s
Returns Beta

News
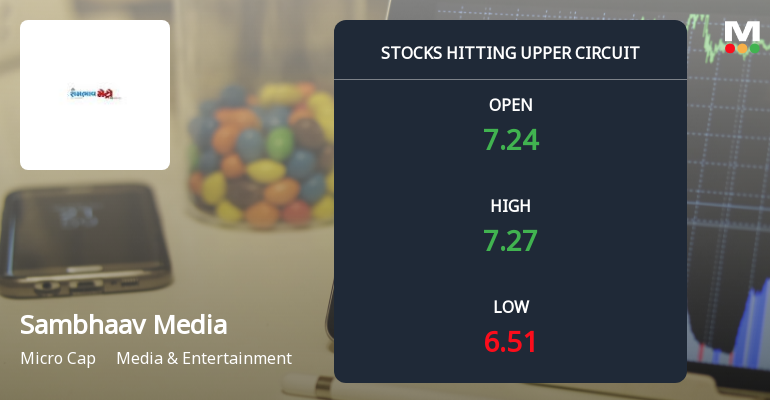
Sambhaav Media Ltd Locks at Upper Circuit With 5.72% Gain — Buyers Queue, Sellers Absent
At Rs 7.30, the buying was done — not because demand dried up, but because the exchange wouldn't let the stock go any higher. Sambhaav Media Ltd locked at its upper circuit of 5.72% on 18 Jun 2026, with buyers queuing and no sellers willing to part with shares.
Read full news article
Sambhaav Media Ltd is Rated Strong Sell
Sambhaav Media Ltd is rated Strong Sell by MarketsMOJO, with this rating last updated on 24 February 2026. However, the analysis and financial metrics discussed here reflect the stock’s current position as of 16 June 2026, providing investors with an up-to-date view of the company’s fundamentals, valuation, financial trends, and technical outlook.
Read full news article
Sambhaav Media Ltd is Rated Strong Sell
Sambhaav Media Ltd is rated Strong Sell by MarketsMOJO, with this rating last updated on 24 February 2026. However, the analysis and financial metrics discussed here reflect the stock’s current position as of 01 June 2026, providing investors with an up-to-date view of the company’s fundamentals, valuation, financial trends, and technical outlook.
Read full news article Announcements
Announcement U/R 30 Of SEBI (LODR)
05-Jun-2026 | Source : BSEAnnouncement
Announcement under Regulation 30 (LODR)-Change in Management
30-May-2026 | Source : BSEResignation
Announcement under Regulation 30 (LODR)-Change in Management
30-May-2026 | Source : BSERevised Submission for Resignation of Mr. Sanajay Gaur as Chief Marketing Officer
Corporate Actions

No Upcoming Board Meetings

No Dividend history available

No Splits history available

No Bonus history available

No Rights history available
Quality key factors
Valuation key factors
Technicals key factors
 Technical Indicator Scale: Bearish, Mildly Bearish, Sideways, Mildly Bullish, Bullish Turned
 Shareholding Snapshot : Mar 2026
Shareholding Compare (%holding)
Promoters
None
Held by 0 Schemes
Held by 1 FIIs (0.25%)
Kiranbhai Bhupatbhai Vadodaria (16.08%)
Nextwave Televentures Private Limited (6.95%)
21.61%
Quarterly Results Snapshot (Consolidated) - Mar'26 - YoY

YoY Growth in quarter ended Mar 2026 is 14.98% vs -16.56% in Mar 2025
YoY Growth in quarter ended Mar 2026 is 1,400.00% vs -101.37% in Mar 2025
Half Yearly Results Snapshot (Consolidated) - Sep'25

Growth in half year ended Sep 2025 is -2.57% vs 20.49% in Sep 2024
Growth in half year ended Sep 2025 is -700.00% vs 96.98% in Sep 2024
Nine Monthly Results Snapshot (Consolidated) - Dec'25
YoY Growth in nine months ended Dec 2025 is -1.26% vs 15.12% in Dec 2024
YoY Growth in nine months ended Dec 2025 is -136.36% vs 127.50% in Dec 2024
Annual Results Snapshot (Consolidated) - Mar'26
YoY Growth in year ended Mar 2026 is 2.94% vs 4.78% in Mar 2025
YoY Growth in year ended Mar 2026 is -40.00% vs -33.33% in Mar 2025
About Sambhaav Media Ltd

Company Coordinates


