
Compare Integra Capital with Similar Stocks
Stock DNA
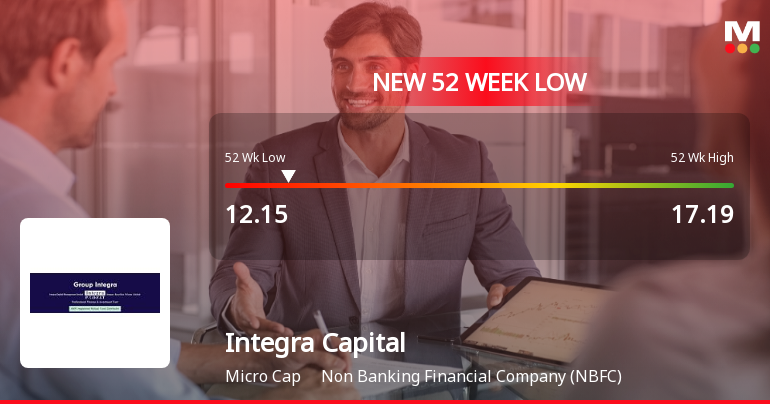
Non Banking Financial Company (NBFC)
INR 6 Cr (Micro Cap)
8.00
21
0.00%
0.00
13.58%
1.10
Total Returns (Price + Dividend) 
Integra Capital for the last several years.
Risk Adjusted Returns v/s
Returns Beta

News
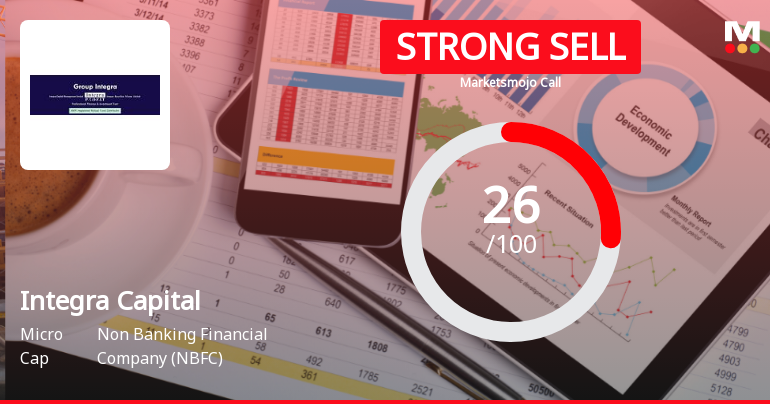
Integra Capital Management Ltd Downgraded to Strong Sell Amid Weak Financials and Bearish Technicals
Integra Capital Management Ltd, a micro-cap player in the Non Banking Financial Company (NBFC) sector, has been downgraded from a Sell to a Strong Sell rating by MarketsMOJO as of 16 Jul 2026. This revision reflects deteriorating technical indicators, flat financial performance, and persistent underperformance against benchmarks, signalling heightened risks for investors.
Read full news article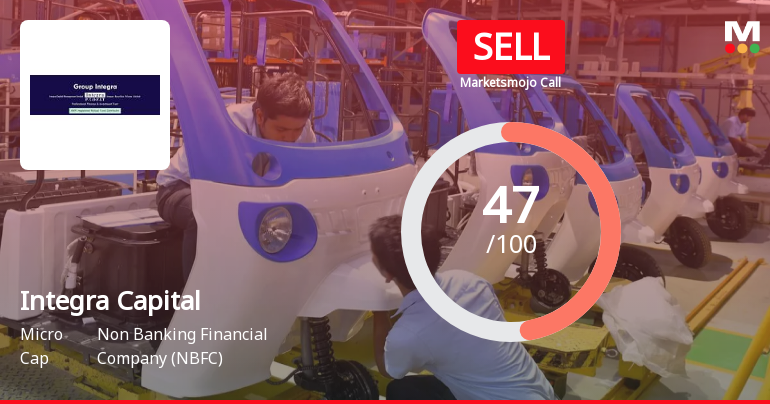
Integra Capital Management Ltd Downgraded to Sell Amid Technical and Financial Concerns
Integra Capital Management Ltd, a micro-cap player in the Non Banking Financial Company (NBFC) sector, has seen its investment rating downgraded from Hold to Sell as of 16 June 2026. This shift reflects a combination of deteriorating technical indicators, flat financial performance, and persistent underperformance against benchmarks, despite an attractive valuation. The company’s Mojo Score has declined to 47.0, signalling caution for investors amid mixed signals across quality, valuation, financial trends, and technicals.
Read full news article Announcements
Compliances-Certificate under Reg. 74 (5) of SEBI (DP) Regulations 2018
06-Jul-2026 | Source : BSECertificate under Regulation 74(5) of SEBI (DP) Regulations 2018 for the quarter ended June 2026
Closure of Trading Window
26-Jun-2026 | Source : BSEIntimation for closure of trading window for the quarter ended June 2026
Announcement under Regulation 30 (LODR)-Newspaper Publication
19-May-2026 | Source : BSEExtract of newspaper publication of Financial results for the quarter & year ended March 2026
Corporate Actions

No Upcoming Board Meetings

No Dividend history available

No Splits history available

No Bonus history available

No Rights history available
Quality key factors
Valuation key factors
Technicals key factors
 Technical Indicator Scale: Bearish, Mildly Bearish, Sideways, Mildly Bullish, Bullish Turned
 Shareholding Snapshot : Jun 2026
Shareholding Compare (%holding)
Promoters
None
Held by 0 Schemes
Held by 0 FIIs
Tarun Vohra (30.65%)
Shon Randhawa (24.99%)
23.37%
Quarterly Results Snapshot (Standalone) - Mar'26 - QoQ

QoQ Growth in quarter ended Mar 2026 is -132.08% vs 1,225.00% in Dec 2025
QoQ Growth in quarter ended Mar 2026 is -144.62% vs 828.57% in Dec 2025
Half Yearly Results Snapshot (Standalone) - Sep'25
Growth in half year ended Sep 2025 is -34.57% vs 55.77% in Sep 2024
Growth in half year ended Sep 2025 is -22.45% vs 19.51% in Sep 2024
Nine Monthly Results Snapshot (Standalone) - Dec'25

YoY Growth in nine months ended Dec 2025 is 205.77% vs -48.00% in Dec 2024
YoY Growth in nine months ended Dec 2025 is 442.11% vs -77.11% in Dec 2024
Annual Results Snapshot (Standalone) - Mar'26
YoY Growth in year ended Mar 2026 is 175.86% vs -76.80% in Mar 2025
YoY Growth in year ended Mar 2026 is 86.96% vs -76.04% in Mar 2025
About Integra Capital Management Ltd

Company Coordinates


