
Compare Decillion Financ with Similar Stocks
Dashboard
With a Operating Losses, the company has a Weak Long Term Fundamental Strength
- Poor long term growth as Operating profit has grown by an annual rate of -6.36%
Flat results in Mar 26
With ROE of -0.3, it has a Expensive valuation with a 1 Price to Book Value
Underperformed the market in the last 1 year
Stock DNA
Non Banking Financial Company (NBFC)
INR 13 Cr (Micro Cap)
NA (Loss Making)
21
0.00%
0.00
-0.31%
1.04
Total Returns (Price + Dividend) 
Decillion Financ for the last several years.
Risk Adjusted Returns v/s
Returns Beta

News
Decillion Finance Ltd Falls to 52-Week Low of Rs 36.04 as Sell-Off Deepens
For the fourth consecutive session, Decillion Finance Ltd has closed lower, culminating in a fresh 52-week low of Rs 36.04 on 19 Jun 2026. This marks an 18.52% decline over the past four days, underscoring persistent selling pressure amid a broader market that remains volatile but not uniformly weak.
Read full news article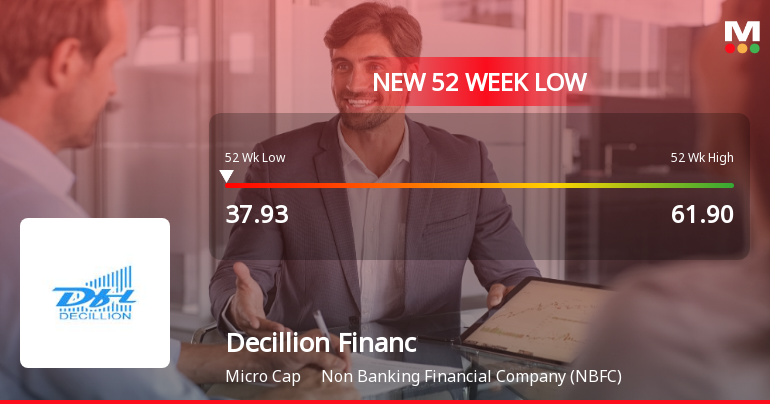
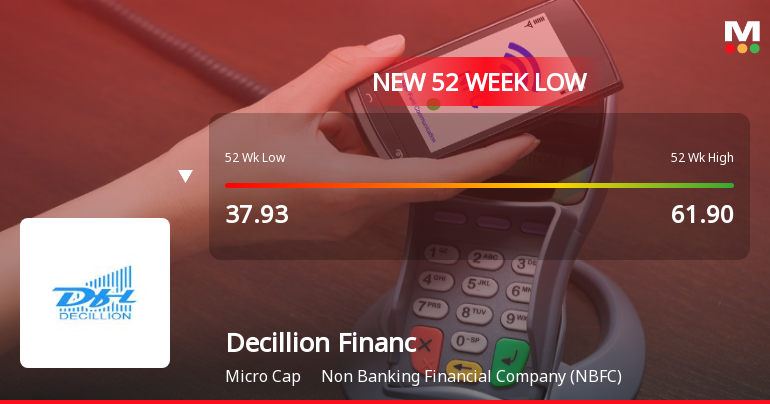
Decillion Finance Ltd Falls to 52-Week Low of Rs 37.93 as Sell-Off Deepens
For the third consecutive session, Decillion Finance Ltd has seen its share price decline, culminating in a fresh 52-week low of Rs 37.93 on 18 Jun 2026. This marks a 14.24% drop over the last three days, underscoring persistent selling pressure despite a broadly stable market backdrop.
Read full news article Announcements
Announcement under Regulation 30 (LODR)-Resignation of Company Secretary / Compliance Officer
11-Jun-2026 | Source : BSEThis is to inform that we have received an email from the exchange with respect to corporate announcement filed on 29.05.2026. The documents and information required by the Exchange is provided in the document attached. Kindly take the same on record and oblige.
Announcement under Regulation 30 (LODR)-Resignation of Statutory Auditors
05-Jun-2026 | Source : BSEPlease find attached the document along with resignation letter of the Statutory Auditor. This is for your information and records
Announcement under Regulation 30 (LODR)-Newspaper Publication
30-May-2026 | Source : BSEThe newspaper clippings for board meeting held on 29.05.2026 for consideration and approval of audited financial statements for the quarter and year ended 31.03.2026
Corporate Actions

No Upcoming Board Meetings

No Dividend history available

No Splits history available

No Bonus history available

No Rights history available
Quality key factors
Valuation key factors
Technicals key factors
 Technical Indicator Scale: Bearish, Mildly Bearish, Sideways, Mildly Bullish, Bullish Turned
 Shareholding Snapshot : Mar 2026
Shareholding Compare (%holding)
Non Institution
None
Held by 0 Schemes
Held by 0 FIIs
Tubro Consultants And Enterprises Privat (22.5%)
Premilaben Rajendrakumar Kothari . (4.66%)
40.48%
Quarterly Results Snapshot (Standalone) - Mar'26 - QoQ

QoQ Growth in quarter ended Mar 2026 is 0.00% vs -7.41% in Dec 2025
QoQ Growth in quarter ended Mar 2026 is 56.00% vs -219.05% in Dec 2025
Half Yearly Results Snapshot (Standalone) - Sep'25

Growth in half year ended Sep 2025 is 1.89% vs 6.00% in Sep 2024
Growth in half year ended Sep 2025 is 88.24% vs -15.00% in Sep 2024
Nine Monthly Results Snapshot (Standalone) - Dec'25
YoY Growth in nine months ended Dec 2025 is 0.00% vs 5.33% in Dec 2024
YoY Growth in nine months ended Dec 2025 is 153.85% vs -144.83% in Dec 2024
Annual Results Snapshot (Standalone) - Mar'26
YoY Growth in year ended Mar 2026 is -0.95% vs 5.00% in Mar 2025
YoY Growth in year ended Mar 2026 is -142.86% vs 333.33% in Mar 2025
About Decillion Finance Ltd

Company Coordinates


