
Compare Kokuyo Camlin with Similar Stocks
Dashboard
Flat results in Mar 26
- PAT(Q) At Rs 2.88 cr has Fallen at -56.2% (vs previous 4Q average)
- PBDIT(Q) Lowest at Rs 10.83 cr.
- OPERATING PROFIT TO NET SALES (Q) Lowest at 4.79%
Despite the size of the company, domestic mutual funds hold only 0% of the company
Consistent Underperformance against the benchmark over the last 3 years
Total Returns (Price + Dividend) 
Latest dividend: 0.5 per share ex-dividend date: Jul-30-2024
Risk Adjusted Returns v/s
Returns Beta

News
Kokuyo Camlin Ltd is Rated Sell
Kokuyo Camlin Ltd is rated Sell by MarketsMOJO, with this rating last updated on 10 September 2025. However, the analysis and financial metrics discussed here reflect the stock's current position as of 15 June 2026, providing investors with an up-to-date view of the company’s fundamentals, returns, and market standing.
Read full news article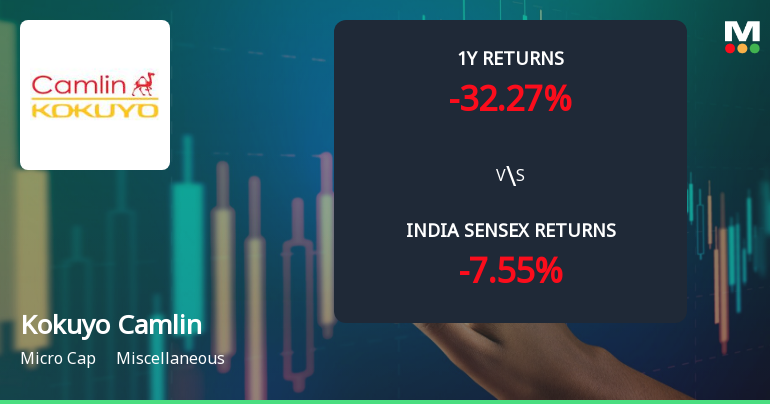
Kokuyo Camlin Ltd Technical Momentum Shifts Amid Mixed Market Signals
Kokuyo Camlin Ltd has experienced a nuanced shift in its technical momentum, reflecting a complex interplay of bullish and bearish signals across multiple timeframes. Despite a recent 2.52% gain in daily price, the stock remains under pressure from longer-term bearish trends, prompting a downgrade in its Mojo Grade from Hold to Sell as of 10 Sep 2025.
Read full news article
Kokuyo Camlin Ltd Technical Momentum Shifts Amid Bearish Outlook
Kokuyo Camlin Ltd, a micro-cap player in the miscellaneous sector, has experienced a notable shift in its technical momentum, with key indicators signalling a transition from mildly bearish to bearish trends. Despite a recent downgrade from Hold to Sell by MarketsMOJO, the stock’s price action and technical parameters reveal a complex interplay of bullish and bearish signals that investors should carefully analyse.
Read full news article Announcements
Intimation Under Regulation 30 Of SEBI (LODR) Regulations 2015
15-Jun-2026 | Source : BSEIntimation under regulation 30 of SEBI (LODR) Regulations 2015
Announcement under Regulation 30 (LODR)-Credit Rating
21-May-2026 | Source : BSEEnclosed
Intimation Of Record Date For Payment Of Dividend If Declared For The Year Ended 31St March 2026
18-May-2026 | Source : BSEIntimation of record date for payment of dividend if declared for the year ended 31st March 2026
Corporate Actions

No Upcoming Board Meetings

Kokuyo Camlin Ltd has declared 30% dividend, ex-date: 30 Jul 26

Kokuyo Camlin Ltd has announced 1:10 stock split, ex-date: 22 Aug 08

No Bonus history available

Kokuyo Camlin Ltd has announced 14:29 rights issue, ex-date: 01 Aug 13
Quality key factors
Valuation key factors
Technicals key factors
 Technical Indicator Scale: Bearish, Mildly Bearish, Sideways, Mildly Bullish, Bullish Turned
 Shareholding Snapshot : Mar 2026
Shareholding Compare (%holding)
Promoters
None
Held by 0 Schemes
Held by 7 FIIs (0.1%)
Kokuyo Company Limited (74.44%)
Equity Intelligence India Private Limited (1.01%)
19.28%
Quarterly Results Snapshot (Standalone) - Mar'26 - QoQ

QoQ Growth in quarter ended Mar 2026 is 27.14% vs 2.16% in Dec 2025
QoQ Growth in quarter ended Mar 2026 is -27.64% vs -49.36% in Dec 2025
Half Yearly Results Snapshot (Standalone) - Sep'25
Growth in half year ended Sep 2025 is -0.05% vs -6.78% in Sep 2024
Growth in half year ended Sep 2025 is 219.43% vs -79.86% in Sep 2024
Nine Monthly Results Snapshot (Standalone) - Dec'25
YoY Growth in nine months ended Dec 2025 is 3.06% vs -6.11% in Dec 2024
YoY Growth in nine months ended Dec 2025 is 1,410.34% vs -95.66% in Dec 2024
Annual Results Snapshot (Standalone) - Mar'26
YoY Growth in year ended Mar 2026 is 5.71% vs -6.61% in Mar 2025
YoY Growth in year ended Mar 2026 is 325.21% vs -86.70% in Mar 2025
About Kokuyo Camlin Ltd

Company Coordinates


