
Compare Frontier Springs with Similar Stocks
Dashboard
Company has a Debt to Equity ratio (avg) of 0.02 times
Healthy long term growth as Net Sales has grown by an annual rate of 33.15% and Operating profit at 51.91%
The company has declared Positive results for the last 11 consecutive quarters
With ROE of 33.4, it has a Very Expensive valuation with a 9.3 Price to Book Value
Despite the size of the company, domestic mutual funds hold only 0% of the company
Consistent Returns over the last 3 years
Stock DNA
Auto Components & Equipments
INR 1,719 Cr (Small Cap)
28.00
24
0.04%
0.04
33.42%
9.33
Total Returns (Price + Dividend) 
Latest dividend: 0.5940000000000001 per share ex-dividend date: Sep-15-2025
Risk Adjusted Returns v/s
Returns Beta

News

Frontier Springs Ltd is Rated Hold by MarketsMOJO
Frontier Springs Ltd is rated 'Hold' by MarketsMOJO, with this rating last updated on 29 May 2026. While the rating change occurred on that date, the analysis and financial metrics discussed here reflect the company’s current position as of 23 June 2026, providing investors with the latest insights into the stock’s fundamentals, valuation, financial trends, and technical outlook.
Read full news article
Frontier Springs Ltd is Rated Hold
Frontier Springs Ltd is rated 'Hold' by MarketsMOJO, with this rating last updated on 29 May 2026. However, the analysis and financial metrics discussed here reflect the company’s current position as of 12 June 2026, providing investors with the latest insights into its performance and outlook.
Read full news article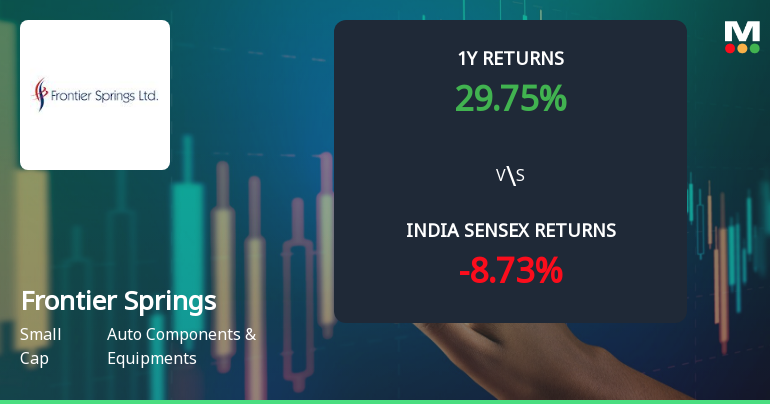
Frontier Springs Ltd Technical Momentum Shifts Amid Mixed Indicator Signals
Frontier Springs Ltd, a small-cap player in the Auto Components & Equipments sector, has experienced a notable shift in its technical momentum, reflecting a nuanced market sentiment. While some indicators maintain bullish undertones, others signal caution, prompting a downgrade in its Mojo Grade from Buy to Hold as of 20 May 2026.
Read full news article Announcements
Announcement under Regulation 30 (LODR)-Earnings Call Transcript
05-Jun-2026 | Source : BSEEarning Call Transcript of Concall held on June 32026.
Announcement under Regulation 30 (LODR)-Analyst / Investor Meet - Outcome
03-Jun-2026 | Source : BSELink for Concall of Company held today.
Announcement under Regulation 30 (LODR)-Newspaper Publication
01-Jun-2026 | Source : BSEExtract of Audited financial Results for the quarter and year ended March 312026.
Corporate Actions

No Upcoming Board Meetings

Frontier Springs Ltd has declared 18% dividend, ex-date: 15 Sep 25

No Splits history available

Frontier Springs Ltd has announced 2:1 bonus issue, ex-date: 13 Mar 26

No Rights history available
Quality key factors
Valuation key factors
Technicals key factors
 Technical Indicator Scale: Bearish, Mildly Bearish, Sideways, Mildly Bullish, Bullish Turned
 Shareholding Snapshot : Mar 2026
Shareholding Compare (%holding)
Promoters
None
Held by 0 Schemes
Held by 1 FIIs (0.0%)
Kamla Bhatia (15.9%)
Frontier Springs Ltd (3.31%)
31.21%
Quarterly Results Snapshot (Standalone) - Mar'26 - YoY

YoY Growth in quarter ended Mar 2026 is 17.78% vs 58.77% in Mar 2025
YoY Growth in quarter ended Mar 2026 is 42.28% vs 130.89% in Mar 2025
Half Yearly Results Snapshot (Standalone) - Sep'25
Growth in half year ended Sep 2025 is 53.49% vs 76.81% in Sep 2024
Growth in half year ended Sep 2025 is 113.38% vs 202.97% in Sep 2024
Nine Monthly Results Snapshot (Standalone) - Dec'25
YoY Growth in nine months ended Dec 2025 is 48.52% vs 76.68% in Dec 2024
YoY Growth in nine months ended Dec 2025 is 94.48% vs 190.04% in Dec 2024
Annual Results Snapshot (Standalone) - Mar'26
YoY Growth in year ended Mar 2026 is 39.22% vs 70.84% in Mar 2025
YoY Growth in year ended Mar 2026 is 76.89% vs 166.82% in Mar 2025
About Frontier Springs Ltd

Company Coordinates


