
Compare Alembic with Similar Stocks
Dashboard
Flat results in Mar 26
- PBT LESS OI(Q) At Rs 16.30 cr has Fallen at -31.97%
- OPERATING PROFIT TO NET SALES (Q) Lowest at 33.66%
With ROE of 13, it has a Very Expensive valuation with a 1 Price to Book Value
Despite the size of the company, domestic mutual funds hold only 0% of the company
Underperformed the market in the last 1 year
Total Returns (Price + Dividend) 
Latest dividend: 2.4043030031376063 per share ex-dividend date: Aug-05-2025
Risk Adjusted Returns v/s
Returns Beta

News

Alembic Ltd is Rated Sell
Alembic Ltd is rated 'Sell' by MarketsMOJO, with this rating last updated on 07 July 2025. However, the analysis and financial metrics discussed here reflect the stock's current position as of 14 June 2026, providing investors with an up-to-date perspective on the company’s performance and outlook.
Read full news article
Alembic Ltd Technical Momentum Shifts Amid Bearish Market Sentiment
Alembic Ltd, a small-cap player in the Realty sector, has experienced a notable shift in its technical momentum, reflecting a complex interplay of bearish and mildly bullish signals. Recent technical indicators reveal a nuanced picture, with the company’s stock price retreating to ₹85.91, down 1.45% on 9 June 2026, amid broader market pressures and sectoral challenges.
Read full news article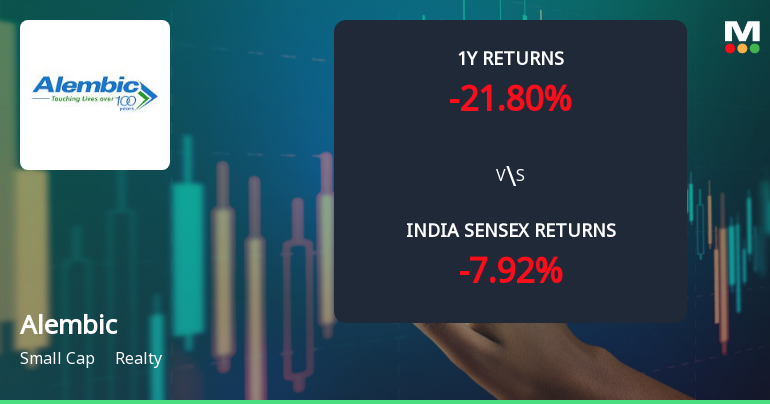
Alembic Ltd Technical Momentum Shifts Amid Bearish Outlook
Alembic Ltd, a small-cap player in the realty sector, has experienced a notable shift in its technical momentum, with key indicators signalling a bearish trend. Despite some mildly bullish signals on shorter timeframes, the overall technical landscape points to increased selling pressure, reflected in the company’s recent price performance and downgrades in its market sentiment.
Read full news article Announcements
Announcement under Regulation 30 (LODR)-Newspaper Publication
11-Jun-2026 | Source : BSEPlease find enclose herewith paper cuttings of newspaper advertisement issued regarding another special window opened for transfer and dematerialization of physical securities.
Announcement under Regulation 30 (LODR)-Newspaper Publication
09-Jun-2026 | Source : BSEplease find attached herewith a copy of the advance notice published in compliance with the procedure prescribed vide various circulars issued from time to time by MCA and SEBI inter alia informing the members about the 119th Annual General Meeting of the Company and sharing the procedure to register / update their details.
Intimation Under Regulation 30 Of SEBI (Listing Obligations And Disclosure Requirements) Regulations 2015
05-Jun-2026 | Source : BSEPlease find enclosed herewith the specimen copy of the reminder letter sent to the shareholders holding shares in physical form for updating their KYC details.
Corporate Actions

No Upcoming Board Meetings

Alembic Ltd has declared 120% dividend, ex-date: 05 Aug 25

Alembic Ltd has announced 2:10 stock split, ex-date: 26 Sep 06

Alembic Ltd has announced 1:1 bonus issue, ex-date: 27 Sep 13

No Rights history available
Quality key factors
Valuation key factors
Technicals key factors
 Technical Indicator Scale: Bearish, Mildly Bearish, Sideways, Mildly Bullish, Bullish Turned
 Shareholding Snapshot : Mar 2026
Shareholding Compare (%holding)
Promoters
None
Held by 1 Schemes (0.0%)
Held by 41 FIIs (1.25%)
Nirayu Private Limited (63.06%)
None
22.13%
Quarterly Results Snapshot (Consolidated) - Mar'26 - YoY

YoY Growth in quarter ended Mar 2026 is -0.38% vs 22.90% in Mar 2025

YoY Growth in quarter ended Mar 2026 is -1.93% vs -5.13% in Mar 2025
Half Yearly Results Snapshot (Consolidated) - Sep'25
Growth in half year ended Sep 2025 is 1.84% vs 50.03% in Sep 2024
Growth in half year ended Sep 2025 is 7.52% vs 30.93% in Sep 2024
Nine Monthly Results Snapshot (Consolidated) - Dec'25
YoY Growth in nine months ended Dec 2025 is 11.34% vs 49.04% in Dec 2024
YoY Growth in nine months ended Dec 2025 is 3.32% vs 23.30% in Dec 2024
Annual Results Snapshot (Consolidated) - Mar'26
YoY Growth in year ended Mar 2026 is 8.16% vs 40.89% in Mar 2025
YoY Growth in year ended Mar 2026 is 2.16% vs 15.66% in Mar 2025
About Alembic Ltd

Company Coordinates


