
Compare Vertex Secur. with Similar Stocks
Stock DNA
Non Banking Financial Company (NBFC)
INR 25 Cr (Micro Cap)
NA (Loss Making)
21
0.00%
0.59
-23.20%
2.41
Total Returns (Price + Dividend) 
Vertex Secur. for the last several years.
Risk Adjusted Returns v/s
Returns Beta

News
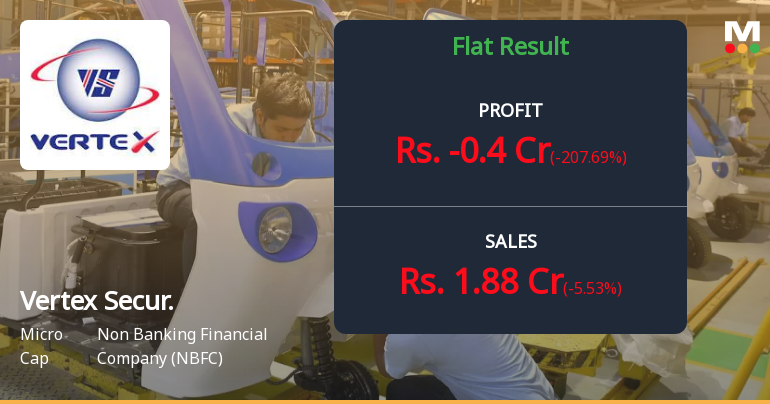
Vertex Securities Q1 FY27: Losses Deepen as Brokerage Firm Struggles with Operational Inefficiencies
Vertex Securities Ltd., a Kerala-based brokerage firm with memberships across NSE, BSE, and multiple commodity exchanges, reported a net loss of ₹0.40 crores for Q1 FY27, marking a sharp 207.69% deterioration from the ₹0.13 crore loss in Q1 FY26. The micro-cap company's shares traded at ₹3.38 on July 31, 2026, reflecting a modest 2.42% single-day gain but continuing to struggle with persistent operational challenges that have plagued the firm for multiple quarters.
Read full news article
Vertex Securities Ltd Downgraded to Strong Sell Amid Weak Financials and Mixed Technicals
Vertex Securities Ltd, a micro-cap player in the Non Banking Financial Company (NBFC) sector, has seen its investment rating downgraded from Sell to Strong Sell as of 21 July 2026. This shift reflects a complex interplay of deteriorating financial fundamentals, cautious valuation metrics, and nuanced technical signals, underscoring heightened risks for investors despite some pockets of market-beating returns.
Read full news article
Vertex Securities Ltd Upgraded to Sell as Technicals Improve Despite Weak Fundamentals
Vertex Securities Ltd, a micro-cap player in the Non Banking Financial Company (NBFC) sector, has seen its investment rating upgraded from Strong Sell to Sell as of 13 July 2026. This change reflects a nuanced assessment where technical indicators have improved markedly, even as the company’s financial fundamentals remain under pressure. The upgrade is primarily driven by a bullish shift in technical trends, while valuation concerns and deteriorating financial performance continue to weigh on investor sentiment.
Read full news article Announcements
Board Meeting Intimation for Prior Intimation Under Regulation 29 Of SEBI (Listing Obligations And Disclosure Requirements) Regulations 2015 As Amended (Listing Regulations)
24-Jul-2026 | Source : BSEVertex Securities Ltdhas informed BSE that the meeting of the Board of Directors of the Company is scheduled on 30/07/2026 inter alia to consider and approve Unaudited Financial Results (Standalone and Consolidated) for the quarter ended June 30 2026.
Compliances-Certificate under Reg. 74 (5) of SEBI (DP) Regulations 2018
14-Jul-2026 | Source : BSECertificate under Regulation 74(5) of SEBI DP Regulations 2018 for the quarter ended June 30 2026.
Closure of Trading Window
25-Jun-2026 | Source : BSEIntimation of closure of the Trading Window under SEBI (Prohibition of Insider Trading) Regulation 2015.
Corporate Actions

No Upcoming Board Meetings

Vertex Securities Ltd has declared 5% dividend, ex-date: 20 Oct 06

Vertex Securities Ltd has announced 2:10 stock split, ex-date: 17 Oct 11

No Bonus history available

Vertex Securities Ltd has announced 1:1 rights issue, ex-date: 12 Mar 26
Quality key factors
Valuation key factors
Technicals key factors
 Technical Indicator Scale: Bearish, Mildly Bearish, Sideways, Mildly Bullish, Bullish Turned
 Shareholding Snapshot : Jun 2026
Shareholding Compare (%holding)
Non Institution
None
Held by 0 Schemes
Held by 0 FIIs
Transwarranty Finance Ltd (26.52%)
Pravin Dhairyashil Khatau (1.13%)
22.49%
Quarterly Results Snapshot (Consolidated) - Jun'26 - YoY

YoY Growth in quarter ended Jun 2026 is -5.53% vs -20.40% in Jun 2025
YoY Growth in quarter ended Jun 2026 is -207.69% vs -244.44% in Jun 2025
Half Yearly Results Snapshot (Consolidated) - Sep'25

Growth in half year ended Sep 2025 is -25.86% vs 45.81% in Sep 2024
Growth in half year ended Sep 2025 is -282.14% vs 203.70% in Sep 2024
Nine Monthly Results Snapshot (Consolidated) - Dec'25
YoY Growth in nine months ended Dec 2025 is -17.52% vs 26.94% in Dec 2024
YoY Growth in nine months ended Dec 2025 is -475.00% vs 27.27% in Dec 2024
Annual Results Snapshot (Consolidated) - Mar'26
YoY Growth in year ended Mar 2026 is -17.56% vs -0.36% in Mar 2025
YoY Growth in year ended Mar 2026 is -238.57% vs -248.94% in Mar 2025
About Vertex Securities Ltd

Company Coordinates


