
Compare Paushak with Similar Stocks
Dashboard
Company has a Debt to Equity ratio (avg) of 0.03 times
Poor long term growth as Operating profit has grown by an annual rate -2.83% of over the last 5 years
Flat results in Mar 26
With ROE of 8, it has a Very Expensive valuation with a 2.9 Price to Book Value
Despite the size of the company, domestic mutual funds hold only 0% of the company
Consistent Underperformance against the benchmark over the last 3 years
Stock DNA
Specialty Chemicals
INR 1,440 Cr (Micro Cap)
36.00
28
0.43%
0.10
8.01%
2.91
Total Returns (Price + Dividend) 
Latest dividend: 2.502291685764048 per share ex-dividend date: Jul-23-2026
Risk Adjusted Returns v/s
Returns Beta

News

Paushak Ltd Upgraded to Hold by MarketsMOJO Amid Mixed Financial and Technical Signals
Paushak Ltd, a micro-cap player in the specialty chemicals sector, has seen its investment rating upgraded from Sell to Hold, reflecting a nuanced shift in its technical outlook despite ongoing financial challenges. The upgrade, effective from 28 July 2026, is driven primarily by improvements in technical indicators, while valuation and financial trends remain subdued, signalling cautious optimism among investors.
Read full news article
Paushak Ltd Technical Momentum Shifts Signal Mildly Bullish Outlook
Paushak Ltd, a micro-cap player in the specialty chemicals sector, has exhibited a notable shift in its technical momentum, moving from a sideways trend to a mildly bullish stance. Recent technical indicators, including MACD, Bollinger Bands, and moving averages, reveal a nuanced picture of the stock’s price dynamics, suggesting cautious optimism among investors amid mixed signals across weekly and monthly timeframes.
Read full news article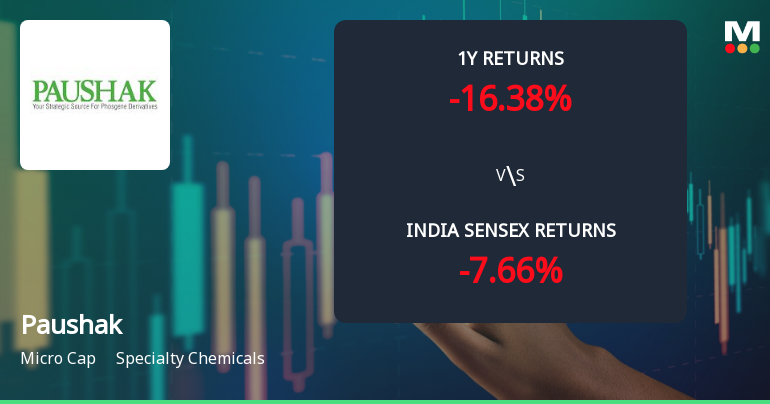
Paushak Ltd Technical Momentum Shifts Amid Mixed Market Signals
Paushak Ltd, a micro-cap player in the specialty chemicals sector, has exhibited a notable shift in its technical momentum, moving from a mildly bearish stance to a sideways trend. Despite a modest day decline of 0.36%, the stock’s technical indicators present a complex picture, with weekly signals showing bullish tendencies contrasting with monthly bearishness. This article delves into the detailed technical parameters, price momentum, and comparative returns to provide a comprehensive analysis for investors.
Read full news article Announcements
Board Meeting Intimation for Board Meeting To Consider Unaudited Financial Results For The Quarter Ended 30Th June 2026.
21-Jul-2026 | Source : BSEPaushak Ltdhas informed BSE that the meeting of the Board of Directors of the Company is scheduled on 30/07/2026 inter alia to consider and approve Board Meeting to consider Unaudited Financial Results for the quarter ended 30th June 2026.
Compliances-Certificate under Reg. 74 (5) of SEBI (DP) Regulations 2018
07-Jul-2026 | Source : BSECertificate under Regulation 74(5) of SEBI (Depositories and Participants) Regulation 2018 for the quarter ended 30th June 2026 received from MUFG Intime India Private Limited.
Announcement under Regulation 30 (LODR)-Newspaper Publication
03-Jul-2026 | Source : BSEPlease find enclosed herewith the newspaper advertisement published on 3rd July 2026.
Corporate Actions

30 Jul 2026

Paushak Ltd has declared 50% dividend, ex-date: 23 Jul 26

Paushak Ltd has announced 5:10 stock split, ex-date: 03 Oct 25

Paushak Ltd has announced 3:1 bonus issue, ex-date: 03 Oct 25

No Rights history available
Quality key factors
Valuation key factors
Technicals key factors
 Technical Indicator Scale: Bearish, Mildly Bearish, Sideways, Mildly Bullish, Bullish Turned
 Shareholding Snapshot : Jun 2026
Shareholding Compare (%holding)
Promoters
None
Held by 0 Schemes
Held by 0 FIIs
Nirayu Private Limited (41.15%)
None
22.49%
Quarterly Results Snapshot (Standalone) - Mar'26 - QoQ

QoQ Growth in quarter ended Mar 2026 is 12.99% vs -16.98% in Dec 2025
QoQ Growth in quarter ended Mar 2026 is 102.76% vs -28.34% in Dec 2025
Half Yearly Results Snapshot (Standalone) - Sep'25

Growth in half year ended Sep 2025 is 4.88% vs 8.65% in Sep 2024
Growth in half year ended Sep 2025 is -15.78% vs 9.12% in Sep 2024
Nine Monthly Results Snapshot (Standalone) - Dec'25
YoY Growth in nine months ended Dec 2025 is 3.08% vs 4.03% in Dec 2024
YoY Growth in nine months ended Dec 2025 is -32.58% vs 10.19% in Dec 2024
Annual Results Snapshot (Standalone) - Mar'26
YoY Growth in year ended Mar 2026 is 3.63% vs 2.27% in Mar 2025
YoY Growth in year ended Mar 2026 is -20.35% vs -9.14% in Mar 2025
About Paushak Ltd

Company Coordinates


