
Compare Manaksia Steels with Similar Stocks
Dashboard
Strong ability to service debt as the company has a low Debt to EBITDA ratio of 1.98 times
With a growth in Net Profit of 101.04%, the company declared Very Positive results in Mar 26
With ROCE of 16.3, it has a Attractive valuation with a 1.3 Enterprise value to Capital Employed
Majority shareholders : Promoters
Market Beating performance in long term as well as near term
Stock DNA
Ferrous Metals
INR 459 Cr (Micro Cap)
11.00
24
0.00%
0.24
12.25%
1.38
Total Returns (Price + Dividend) 
Manaksia Steels for the last several years.
Risk Adjusted Returns v/s
Returns Beta

News
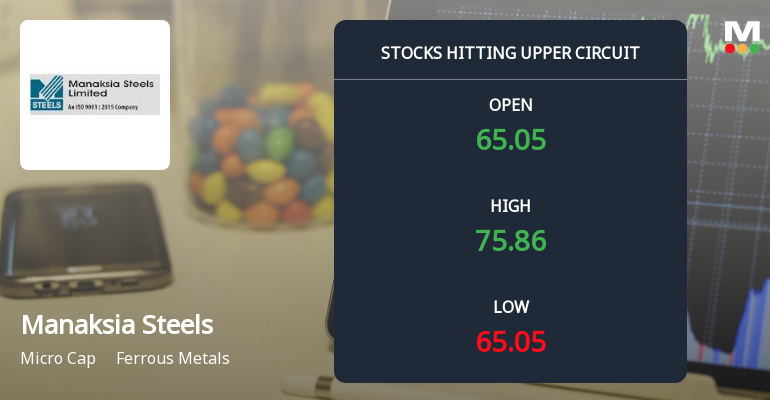
Manaksia Steels Ltd Locks at Upper Circuit With 10% Gain — Buyers Queue, Sellers Absent
At Rs 75.21, the buying was done — not because demand dried up, but because the exchange wouldn't let the stock go any higher. Manaksia Steels Ltd locked at its upper circuit of 9.99% on 3 Aug 2026, with buyers queuing and no sellers willing to part with shares.
Read full news article
Manaksia Steels Ltd is Rated Buy
Manaksia Steels Ltd is rated 'Buy' by MarketsMOJO, with this rating last updated on 25 May 2026. However, the analysis and financial metrics discussed here reflect the stock's current position as of 24 July 2026, providing investors with an up-to-date view of the company’s performance and outlook.
Read full news article
Manaksia Steels Ltd is Rated Buy
Manaksia Steels Ltd is rated 'Buy' by MarketsMOJO, with this rating last updated on 25 May 2026. However, the analysis and financial metrics presented here reflect the stock's current position as of 13 July 2026, providing investors with the most up-to-date insight into the company’s performance and outlook.
Read full news article Announcements
Compliances-Certificate under Reg. 74 (5) of SEBI (DP) Regulations 2018
08-Jul-2026 | Source : BSECertificate under Regulation 74(5) of SEBI (Depositories and Participants) Regulations 2018
Closure of Trading Window
25-Jun-2026 | Source : BSEIntimation for Trading Window Closure for the quarter ended 30th June 2026
Announcement under Regulation 30 (LODR)-Credit Rating
18-Jun-2026 | Source : BSEICRA Limited has assigned the ratings to bank facilities of the Company
Corporate Actions

No Upcoming Board Meetings

No Dividend history available

No Splits history available

No Bonus history available

No Rights history available
Quality key factors
Valuation key factors
Technicals key factors
 Technical Indicator Scale: Bearish, Mildly Bearish, Sideways, Mildly Bullish, Bullish Turned
 Shareholding Snapshot : Jun 2026
Shareholding Compare (%holding)
Promoters
None
Held by 0 Schemes
Held by 0 FIIs
Payal Agrawal (19.51%)
Shree Bahubali Stock Broking Limited (1.23%)
18.14%
Quarterly Results Snapshot (Consolidated) - Mar'26 - QoQ

QoQ Growth in quarter ended Mar 2026 is 4.79% vs 21.01% in Dec 2025
QoQ Growth in quarter ended Mar 2026 is 101.04% vs 113.56% in Dec 2025
Half Yearly Results Snapshot (Consolidated) - Sep'25

Growth in half year ended Sep 2025 is 78.08% vs -29.89% in Sep 2024
Growth in half year ended Sep 2025 is 304.04% vs -85.73% in Sep 2024
Nine Monthly Results Snapshot (Consolidated) - Dec'25
YoY Growth in nine months ended Dec 2025 is 85.54% vs -16.99% in Dec 2024
YoY Growth in nine months ended Dec 2025 is 308.73% vs -78.89% in Dec 2024
Annual Results Snapshot (Consolidated) - Mar'26
YoY Growth in year ended Mar 2026 is 78.33% vs -6.87% in Mar 2025
YoY Growth in year ended Mar 2026 is 309.44% vs -65.64% in Mar 2025
About Manaksia Steels Ltd

Company Coordinates


