
Compare Sinnar Bidi Udy. with Similar Stocks
Dashboard
With a Operating Losses, the company has a Weak Long Term Fundamental Strength
- Company's ability to service its debt is weak with a poor EBIT to Interest (avg) ratio of -0.19
- The company has reported losses. Due to this company has reported negative ROCE
Negative results in Mar 26
Risky - Negative EBITDA
Underperformed the market in the last 1 year
Total Returns (Price + Dividend) 
Sinnar Bidi Udy. for the last several years.
Risk Adjusted Returns v/s
Returns Beta

News
Sinnar Bidi Udyog Ltd is Rated Strong Sell
Sinnar Bidi Udyog Ltd is rated Strong Sell by MarketsMOJO, with this rating last updated on 09 April 2026. However, the analysis and financial metrics discussed here reflect the company’s current position as of 09 July 2026, providing investors with the most recent insights into its performance and outlook.
Read full news article
Sinnar Bidi Udyog Ltd is Rated Strong Sell
Sinnar Bidi Udyog Ltd is rated Strong Sell by MarketsMOJO, with this rating last updated on 09 Apr 2026. However, the analysis and financial metrics discussed below reflect the company’s current position as of 25 June 2026, providing investors with an up-to-date view of the stock’s fundamentals, valuation, financial trend, and technical outlook.
Read full news article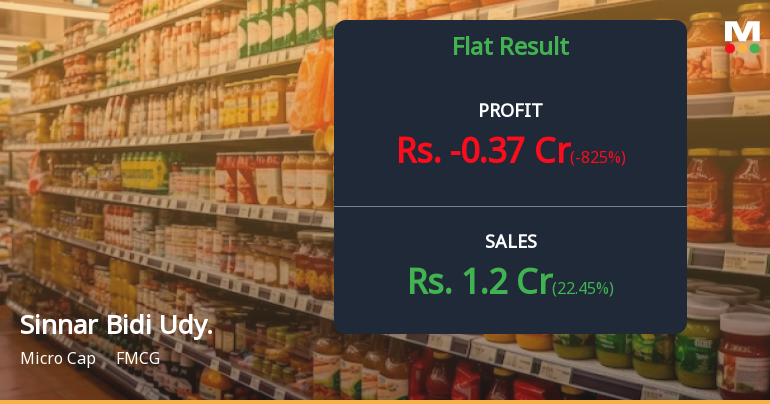
Sinnar Bidi Udyog Q4 FY26: Mounting Losses Deepen Crisis in Micro-Cap Tobacco Processor
Sinnar Bidi Udyog Ltd., a micro-cap tobacco processing company with a market capitalisation of ₹32.00 crores, reported a significant deterioration in its March 2026 quarter results, posting a consolidated net loss of ₹0.37 crores compared to a loss of ₹0.04 crores in the corresponding quarter last year. The loss widened dramatically by 825.00% on a year-on-year basis, marking the company's worst quarterly performance in recent periods and raising serious questions about the viability of its business model.
Read full news article Announcements
Compliances-Certificate under Reg. 74 (5) of SEBI (DP) Regulations 2018
15-Jul-2026 | Source : BSEPursuant to Regulation 30 of SEBI (LODR) 2015 and under Regulation 74(5) of SEBI (DP) Regulation 2018 we have attached certificate submitted by MUFG Intime India Private Limited for quarter ended on 30.06.2026
Board Meeting Outcome for To Note The Fine Levied By BSE For Non-Compliance With Regulation 29 Of The SEBI (LODR) 2015
10-Jul-2026 | Source : BSEThe Board has taken on record email received from BSE for levy of fine for Non-compliance with regulation 29 of SEBI (LODR) regulation 2015. The Board also noted that the Company has paid the fine amount of Rs. 11800/- as levied by the BSE & submitted the details of remittance to the BSE
Closure of Trading Window
27-Jun-2026 | Source : BSEPursuant to SEBI (Prohibition of Insider Trading) Regulations 2015 & Code of Conduct for Prohibition of Insider Trading Of Company trading window will be closed for all the designated person & their immediate relatives from the opening of the Business hours of the stock exchange from 1st July 2026 till 48 hours after declaration of the financial result for the quarter ended on 30th June 2026.
Corporate Actions

No Upcoming Board Meetings

No Dividend history available

Sinnar Bidi Udyog Ltd has announced 5:10 stock split, ex-date: 30 Jul 19

No Bonus history available

No Rights history available
Quality key factors
Valuation key factors
Technicals key factors
 Technical Indicator Scale: Bearish, Mildly Bearish, Sideways, Mildly Bullish, Bullish Turned
 Shareholding Snapshot : Dec 2025
Shareholding Compare (%holding)
Promoters
None
Held by 0 Schemes
Held by 0 FIIs
Rasbihari Enterprises Private Limited (29.2%)
Mandar Ganesh Rajendra (1.3%)
24.84%
Quarterly Results Snapshot (Consolidated) - Mar'26 - YoY

YoY Growth in quarter ended Mar 2026 is 22.45% vs -20.97% in Mar 2025

YoY Growth in quarter ended Mar 2026 is -825.00% vs 63.64% in Mar 2025
Half Yearly Results Snapshot (Consolidated) - Sep'25
Growth in half year ended Sep 2025 is 26.87% vs -3.40% in Sep 2024
Growth in half year ended Sep 2025 is 293.75% vs -194.12% in Sep 2024
Nine Monthly Results Snapshot (Consolidated) - Dec'25
YoY Growth in nine months ended Dec 2025 is 0.53% vs 5.34% in Dec 2024
YoY Growth in nine months ended Dec 2025 is 366.67% vs -139.13% in Dec 2024
Annual Results Snapshot (Consolidated) - Mar'26
YoY Growth in year ended Mar 2026 is 5.29% vs -1.46% in Mar 2025
YoY Growth in year ended Mar 2026 is -8.33% vs -200.00% in Mar 2025
About Sinnar Bidi Udyog Ltd

Company Coordinates


