
Compare Gorani Industrie with Similar Stocks
Dashboard
Weak Long Term Fundamental Strength with a 11.20% CAGR growth in Operating Profits over the last 5 years
- Low ability to service debt as the company has a high Debt to EBITDA ratio of 6.70 times
The company has declared Negative results for the last 3 consecutive quarters
Consistent Underperformance against the benchmark over the last 3 years
Stock DNA
Electronics & Appliances
INR 25 Cr (Micro Cap)
41.00
34
0.00%
0.92
4.43%
1.80
Total Returns (Price + Dividend) 
Gorani Industrie for the last several years.
Risk Adjusted Returns v/s
Returns Beta

News

Gorani Industries Ltd is Rated Strong Sell
Gorani Industries Ltd is rated Strong Sell by MarketsMOJO. This rating was last updated on 02 September 2025. However, the analysis and financial metrics discussed below reflect the stock's current position as of 10 July 2026, providing investors with an up-to-date view of the company’s fundamentals, returns, and market performance.
Read full news article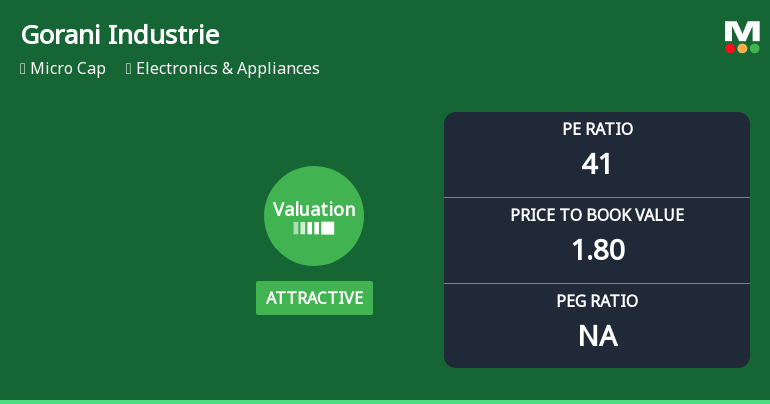
Gorani Industries Ltd Valuation Shifts Signal Changing Price Attractiveness
Gorani Industries Ltd, a micro-cap player in the Electronics & Appliances sector, has witnessed a notable shift in its valuation parameters, moving from a very attractive to an attractive rating. Despite this improvement in price metrics, the company’s stock performance continues to lag behind benchmark indices, raising questions about its near-term prospects and investor appeal.
Read full news articleAre Gorani Industries Ltd latest results good or bad?
Gorani Industries Ltd's latest financial results for Q4 FY26 reveal significant operational challenges. The company reported a net profit of ₹0.04 crores, which reflects a substantial decline compared to previous quarters. Specifically, net profit decreased by 75% quarter-on-quarter, marking a multi-quarter low. Revenue for the same period was ₹7.81 crores, down 13.89% from the preceding quarter, although it showed an 8.47% increase year-on-year. However, this year-on-year growth is overshadowed by the sequential decline, indicating underlying issues in maintaining sales momentum. The operating margin, which fell to 2.30%, represents a significant drop from earlier periods, highlighting severe margin compression. This decline in operating profitability is concerning, as it suggests that the company is facing pressures from pricing, cost inflation, or operational inefficiencies. The operating profit excludi...
Read full news article Announcements
Closure of Trading Window
24-Jun-2026 | Source : BSEGorani Industries Limited hereby submits intimation regarding Closure of Trading Window pursuant to SEBI (Prohibition of Insider Trading) Regulation 2015 for the quarter ended as on 30th June 2026.
Announcement under Regulation 30 (LODR)-Newspaper Publication
09-Jun-2026 | Source : BSEGorani Industries Limited hereby submits Newspaper Publication related to creating awareness about opening of special window for the re-lodgement of transfer requests of physical shares as per SEBI Circular No. SEBI/HO/38/13/11(2)2026-MIRSD-POD/I/3750/2026 dated January 30 2026.
Announcement under Regulation 30 (LODR)-Newspaper Publication
30-May-2026 | Source : BSEGorani Industries Limited hereby submits Newspaper Publication with respect to Audited Financial Results for the Quarter and Year ended as on 31st March 2026 published on 30th May 2026.
Corporate Actions

No Upcoming Board Meetings

No Dividend history available

No Splits history available

No Bonus history available

No Rights history available
Quality key factors
Valuation key factors
Technicals key factors
 Technical Indicator Scale: Bearish, Mildly Bearish, Sideways, Mildly Bullish, Bullish Turned
 Shareholding Snapshot : Mar 2026
Shareholding Compare (%holding)
Promoters
None
Held by 0 Schemes
Held by 0 FIIs
Sanjay Gorani (19.61%)
Online Appliances Llp (15.68%)
19.75%
Quarterly Results Snapshot (Standalone) - Mar'26 - QoQ

QoQ Growth in quarter ended Mar 2026 is -13.89% vs 5.22% in Dec 2025
QoQ Growth in quarter ended Mar 2026 is -75.00% vs -5.88% in Dec 2025
Half Yearly Results Snapshot (Standalone) - Sep'25
Growth in half year ended Sep 2025 is -11.29% vs 14.36% in Sep 2024

Growth in half year ended Sep 2025 is 290.91% vs -84.93% in Sep 2024
Nine Monthly Results Snapshot (Standalone) - Dec'25
YoY Growth in nine months ended Dec 2025 is -18.02% vs 16.50% in Dec 2024
YoY Growth in nine months ended Dec 2025 is 13.46% vs -32.47% in Dec 2024
Annual Results Snapshot (Standalone) - Mar'26
YoY Growth in year ended Mar 2026 is -13.58% vs 1.58% in Mar 2025
YoY Growth in year ended Mar 2026 is -26.74% vs -36.76% in Mar 2025
About Gorani Industries Ltd

Company Coordinates


