
Compare Inani Marbles with Similar Stocks
Dashboard
Weak Long Term Fundamental Strength with a -22.39% CAGR growth in Operating Profits over the last 5 years
- Company's ability to service its debt is weak with a poor EBIT to Interest (avg) ratio of 0.94
- The company has been able to generate a Return on Equity (avg) of 2.54% signifying low profitability per unit of shareholders funds
Flat results in Mar 26
Underperformed the market in the last 1 year
Total Returns (Price + Dividend) 
Latest dividend: 0.04 per share ex-dividend date: Sep-23-2025
Risk Adjusted Returns v/s
Returns Beta

News
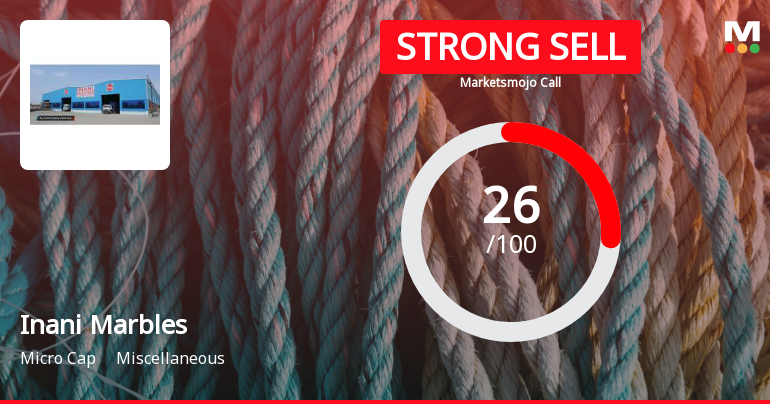
Inani Marbles & Industries Downgraded to Strong Sell Amid Weak Fundamentals and Bearish Technicals
Inani Marbles & Industries Ltd has been downgraded from a Sell to a Strong Sell rating as of 22 June 2026, reflecting deteriorating technical indicators, subdued financial trends, and weak quality metrics. Despite a very attractive valuation, the company’s ongoing operational challenges and bearish market signals have prompted a reassessment of its investment appeal.
Read full news article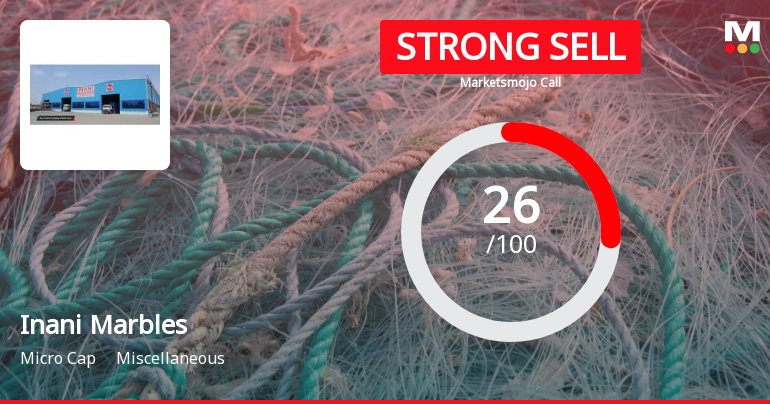
Inani Marbles & Industries Ltd Downgraded to Strong Sell Amid Weak Fundamentals and Bearish Technicals
Inani Marbles & Industries Ltd has been downgraded from a Sell to a Strong Sell rating as of 10 June 2026, reflecting deteriorating technical indicators, weak financial trends, and poor quality metrics. The micro-cap stock, operating in the miscellaneous sector, has underperformed the broader market significantly, prompting a reassessment of its investment appeal.
Read full news articleAre Inani Marbles & Industries Ltd latest results good or bad?
Inani Marbles & Industries Ltd's latest financial results for Q4 FY26 present a complex picture of recovery amidst ongoing challenges. The company reported net sales of ₹10.47 crores, reflecting a sequential growth of 21.18% from the previous quarter, although this represents a year-on-year decline of 6.01% compared to ₹11.14 crores in Q4 FY25. This revenue pattern indicates difficulties in maintaining consistent sales momentum in a competitive environment. The company achieved a net profit of ₹0.41 crores, marking a significant turnaround from losses in the preceding two quarters. However, this profit is substantially lower than the ₹0.79 crores recorded in Q1 FY25, suggesting that while the return to profitability is noteworthy, it may not signify a sustainable trend. The operating margin, excluding other income, improved to 11.46%, the highest in seven quarters, indicating some success in cost managemen...
Read full news article Announcements
Announcement under Regulation 30 (LODR)-Newspaper Publication
01-Jun-2026 | Source : BSENewspaper Publication for Audited Financial Result 31.03.2026
Board Meeting Outcome for Outcome Of Board Meeting Held On 29.05.2026
29-May-2026 | Source : BSEOutcome of Board Meeting held on 29.05.2026
Corporate Action-Board approves Dividend
29-May-2026 | Source : BSEBoard of Director approves dividend @2% i.e. Rs. 0.04 per Equity Shares
Corporate Actions

No Upcoming Board Meetings

Inani Marbles & Industries Ltd has declared 2% dividend, ex-date: 23 Sep 25

Inani Marbles & Industries Ltd has announced 2:10 stock split, ex-date: 10 Nov 16

No Bonus history available

No Rights history available
Quality key factors
Valuation key factors
Technicals key factors
 Technical Indicator Scale: Bearish, Mildly Bearish, Sideways, Mildly Bullish, Bullish Turned
 Shareholding Snapshot : Mar 2026
Shareholding Compare (%holding)
Promoters
None
Held by 0 Schemes
Held by 0 FIIs
Suresh Kumar Inani (13.41%)
Dhruti Rahul Sanghvi (4.65%)
31.11%
Quarterly Results Snapshot (Standalone) - Mar'26 - QoQ

QoQ Growth in quarter ended Mar 2026 is 21.18% vs -32.08% in Dec 2025
QoQ Growth in quarter ended Mar 2026 is 224.24% vs -371.43% in Dec 2025
Half Yearly Results Snapshot (Standalone) - Sep'25
Growth in half year ended Sep 2025 is 27.89% vs -11.50% in Sep 2024

Growth in half year ended Sep 2025 is -93.55% vs 261.46% in Sep 2024
Nine Monthly Results Snapshot (Standalone) - Dec'25
YoY Growth in nine months ended Dec 2025 is 14.62% vs -16.62% in Dec 2024
YoY Growth in nine months ended Dec 2025 is -116.31% vs 370.00% in Dec 2024
Annual Results Snapshot (Standalone) - Mar'26
YoY Growth in year ended Mar 2026 is 9.25% vs -24.37% in Mar 2025
YoY Growth in year ended Mar 2026 is -74.65% vs -54.78% in Mar 2025
About Inani Marbles & Industries Ltd

Company Coordinates


