
Compare Santosh Fin Fab with Similar Stocks
Dashboard
Weak Long Term Fundamental Strength with an average Return on Capital Employed (ROCE) of 2.55%
- Poor long term growth as Net Sales has grown by an annual rate of 8.98% and Operating profit at 18.74% over the last 5 years
- Low ability to service debt as the company has a high Debt to EBITDA ratio of 5.71 times
Flat results in Dec 25
Total Returns (Price + Dividend) 
Santosh Fin Fab for the last several years.
Risk Adjusted Returns v/s
Returns Beta

News
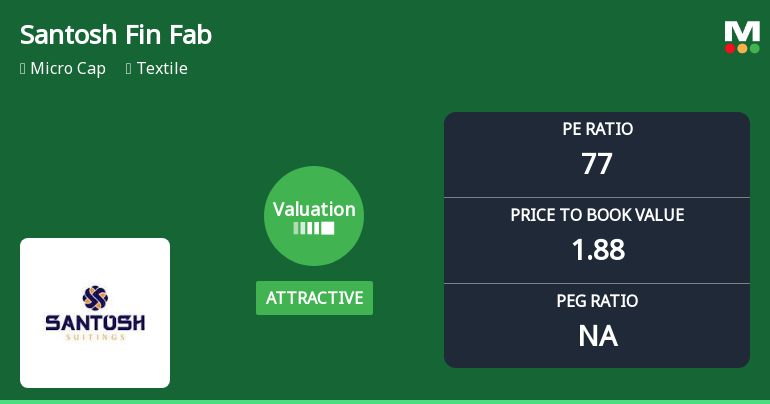
Santosh Fine Fab Ltd Valuation Shifts Signal Renewed Price Attractiveness
Santosh Fine Fab Ltd has witnessed a notable shift in its valuation parameters, moving from a previously risky stance to an attractive valuation grade. This change is underscored by a recalibration of key metrics such as the price-to-earnings (P/E) ratio and price-to-book value (P/BV), positioning the micro-cap stock as a compelling consideration amid its peer group and historical benchmarks.
Read full news article
Santosh Fine Fab Ltd Valuation Shifts Signal Renewed Price Attractiveness
Santosh Fine Fab Ltd has witnessed a notable shift in its valuation parameters, moving from a previously risky stance to an attractive valuation grade. This change is underscored by a significant recalibration of its price-to-earnings (P/E) and price-to-book value (P/BV) ratios relative to historical levels and peer benchmarks, offering investors a fresh perspective on the stock’s price attractiveness amid broader market dynamics.
Read full news article Announcements
Closure of Trading Window
30-Mar-2026 | Source : BSEintimation of closer trading window for dealing in the equity Share of company by designated person is closed from 1st April 2026 and upto 48 Hours after declaration of Audited Financial of company for Quarter ended 31st March 2026
Announcement under Regulation 30 (LODR)-Resignation of Company Secretary / Compliance Officer
18-Mar-2026 | Source : BSEIntimation of Resignation of Company Secretary and Compliance Officer
Un-Audited Financial Result For Quarter Ended 31St December 2025
11-Feb-2026 | Source : BSEfinancial result approved in board meeting held on today 11th February 2026
Corporate Actions

No Upcoming Board Meetings

No Dividend history available

No Splits history available

No Bonus history available

No Rights history available
Quality key factors
Valuation key factors
Technicals key factors
 Technical Indicator Scale: Bearish, Mildly Bearish, Sideways, Mildly Bullish, Bullish Turned
 Shareholding Snapshot : Dec 2025
Shareholding Compare (%holding)
Promoters
None
Held by 0 Schemes
Held by 0 FIIs
Arjun Kumar Tulsiyan (9.41%)
Sunil Tulsiyan Huf (5.1%)
42.41%
Quarterly Results Snapshot (Standalone) - Dec'25 - QoQ

QoQ Growth in quarter ended Dec 2025 is -29.96% vs 17.62% in Sep 2025
QoQ Growth in quarter ended Dec 2025 is 0.00% vs 120.00% in Sep 2025
Half Yearly Results Snapshot (Standalone) - Sep'25

Growth in half year ended Sep 2025 is 20.90% vs 20.00% in Sep 2024
Growth in half year ended Sep 2025 is 82.35% vs 41.38% in Sep 2024
Nine Monthly Results Snapshot (Standalone) - Dec'25
YoY Growth in nine months ended Dec 2025 is 6.24% vs 13.71% in Dec 2024
YoY Growth in nine months ended Dec 2025 is 86.67% vs 54.55% in Dec 2024
Annual Results Snapshot (Standalone) - Mar'25
YoY Growth in year ended Mar 2025 is 28.84% vs -21.15% in Mar 2024
YoY Growth in year ended Mar 2025 is 101.06% vs -9,300.00% in Mar 2024
About Santosh Fine Fab Ltd

Company Coordinates


