
Compare Allcargo Logist. with Similar Stocks
Stock DNA
Transport Services
INR 1,261 Cr (Micro Cap)
77.00
37
0.00%
0.98
2.79%
2.23
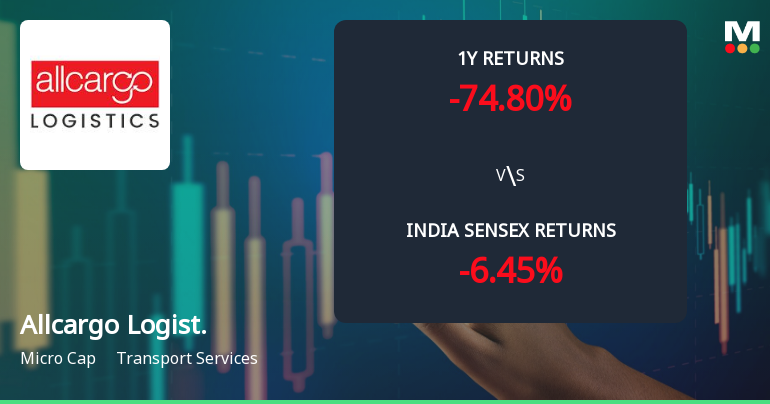
Total Returns (Price + Dividend) 
Latest dividend: 1.1 per share ex-dividend date: Oct-25-2024
Risk Adjusted Returns v/s
Returns Beta

News
Allcargo Logistics Ltd Technical Momentum Shifts Amid Prolonged Downtrend
Allcargo Logistics Ltd, a micro-cap player in the transport services sector, is currently exhibiting a shift towards bearish momentum as technical indicators signal deteriorating price trends. Despite a modest daily price movement, the stock’s longer-term technical parameters reveal significant challenges, with key metrics such as MACD, moving averages, and Bollinger Bands pointing to sustained weakness.
Read full news article
Allcargo Logistics Ltd is Rated Sell
Allcargo Logistics Ltd is rated 'Sell' by MarketsMOJO, with this rating last updated on 01 April 2026. However, the analysis and financial metrics discussed here reflect the stock's current position as of 20 June 2026, providing investors with an up-to-date view of the company’s fundamentals, returns, and market performance.
Read full news article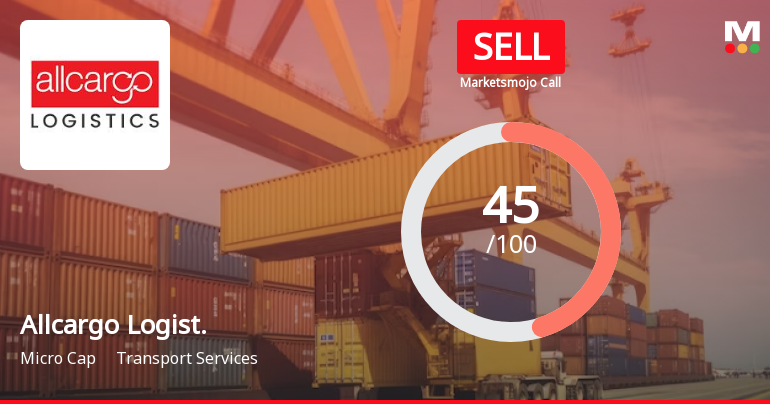
Allcargo Logistics Ltd is Rated Sell
Allcargo Logistics Ltd is rated 'Sell' by MarketsMOJO, with this rating last updated on 01 April 2026. However, the analysis and financial metrics discussed here reflect the stock's current position as of 09 June 2026, providing investors with an up-to-date view of the company's fundamentals, returns, and technical outlook.
Read full news article Announcements
Announcement under Regulation 30 (LODR)-Change in Management
18-Jun-2026 | Source : BSEAs per the attachment
Announcement under Regulation 30 (LODR)-Analyst / Investor Meet - Intimation
09-Jun-2026 | Source : BSEAs per the attachment
Announcement under Regulation 30 (LODR)-Analyst / Investor Meet - Intimation
08-Jun-2026 | Source : BSEAs per the attachment
Corporate Actions

No Upcoming Board Meetings

Allcargo Logistics Ltd has declared 55% dividend, ex-date: 25 Oct 24

Allcargo Logistics Ltd has announced 2:10 stock split, ex-date: 19 Nov 09

Allcargo Logistics Ltd has announced 3:1 bonus issue, ex-date: 02 Jan 24

No Rights history available
Quality key factors
Valuation key factors
Technicals key factors
 Technical Indicator Scale: Bearish, Mildly Bearish, Sideways, Mildly Bullish, Bullish Turned
 Shareholding Snapshot : Mar 2026
Shareholding Compare (%holding)
Non Institution
None
Held by 3 Schemes (1.2%)
Held by 72 FIIs (7.27%)
Shashi Kiran Shetty (34.41%)
Mukul Mahavir Agrawal (2.94%)
40.16%
Quarterly Results Snapshot (Consolidated) - Mar'26 - QoQ

QoQ Growth in quarter ended Mar 2026 is -0.39% vs -3.91% in Dec 2025
QoQ Growth in quarter ended Mar 2026 is 900.00% vs -77.78% in Dec 2025
Half Yearly Results Snapshot (Consolidated) - Sep'25
Growth in half year ended Sep 2025 is 10.54% vs -85.86% in Sep 2024

Growth in half year ended Sep 2025 is -533.33% vs -97.92% in Sep 2024
Nine Monthly Results Snapshot (Consolidated) - Dec'25
YoY Growth in nine months ended Dec 2025 is 6.56% vs -85.20% in Dec 2024
YoY Growth in nine months ended Dec 2025 is -266.67% vs -101.93% in Dec 2024
Annual Results Snapshot (Consolidated) - Mar'26
YoY Growth in year ended Mar 2026 is 4.95% vs -84.88% in Mar 2025
YoY Growth in year ended Mar 2026 is -87.69% vs -56.58% in Mar 2025
About Allcargo Logistics Ltd

Company Coordinates


